
What binference does
What can you learn about a population when each of its members is measured with noise?
Suppose you have measured many objects: galaxies, merger events, patients, classified documents. Each measurement has an error, so no single object’s true value is known exactly. binference answers two questions from such data:
What is the population the objects come from? binference infers its population fractions \(\rho\), the share of the population in each bin, with their full uncertainty.
What is each object’s true value, given the inferred population? binference gives each object’s hierarchical posterior, which is narrower than its own likelihood wherever the population is informative.
The problem in pictures
The figure follows 2000 simulated objects through binference. Their true values \(z\) come from a population with two peaks on \([0, 3]\). Each object is measured with a Gaussian error between 0.05 and 0.2, and the 15 bins are 0.2 wide.
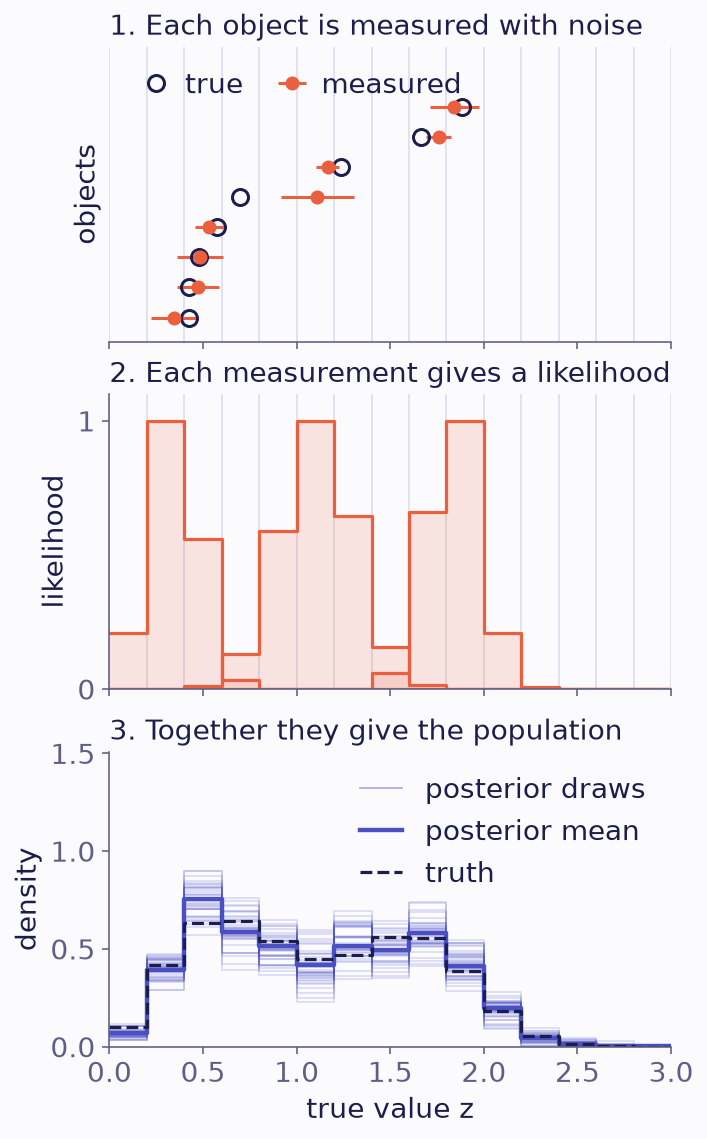
From measurements to a population. (1) Eight of the 2000 objects: each measured value with its error (filled), and its true value (open). (2) Three of their likelihoods averaged over each bin, scaled to a maximum of one. (3) The population density inferred from all 2000 likelihoods: 40 posterior draws, their mean, and the true density (dashed). The spread of the draws is the uncertainty of the population.
The first panel shows why the problem is hard. Some measurements lie two error bars from the truth, and a histogram of the measured values would be broader than the population. The second panel shows what binference works with: each object’s bin-averaged likelihood. The third panel shows the answer. The population is a set of posterior draws, not one curve, and their spread is its uncertainty.
binference also returns each object’s posterior, the realised sample (the histogram of these objects) and any quantity computed from the population.
One model under many names
The model is not new. Several fields derived it independently and named its pieces differently.
field |
an object is |
the population is called |
|---|---|---|
a galaxy or star |
the redshift distribution \(n(z)\) |
|
a merger event |
the mass distribution and merger rate |
|
an event in a detector |
the true spectrum |
|
a unit with a noisy estimate |
the prior \(g\), or mixing distribution |
|
a classified item |
the class prevalence |
|
an individual |
the mixture proportions |
The Fields pages give the full table of names, with each field’s methods and software. The fields’ point estimators are stages of one iteration, EM, derived in the theory.
Next
Is binference right for my data? matches your data to binference’s inputs, and lists what binference does not do.
What binference promises lists what binference promises about its answers.
Install, then the Quick start.