Your first briefing
Once your environment's set up, this page walks through producing your first real briefing — on your own profile, with your own categories, end to end. It takes around ten minutes of active attention, spread across a pipeline run you can mostly walk away from.
The goal is to get through one complete run. Writing the perfect profile or tuning every setting can wait; everything you see here has a deeper page elsewhere in the Guide, and the forward links at each step are safe to skip on the first pass.
This page assumes you've done Install, API keys, and Verify setup — your dev server runs cleanly and your Minimal API Test came back green.
1. Open Aparture and look around
npm run devOpen http://localhost:3000 and enter your ACCESS_PASSWORD. The app is a sidebar on the left plus a main area that renders whatever the sidebar selects. On a phone or any narrow window the sidebar collapses into a drawer — open it with the ☰ button in the top bar.
The sidebar carries a list of past briefings (empty for now), a light/dark theme toggle, and three nav links — Profile, Settings, and Pipeline — that you'll cycle between during this run. Click each one now just to get a feel for the layout; there's nothing to fill in or change yet.
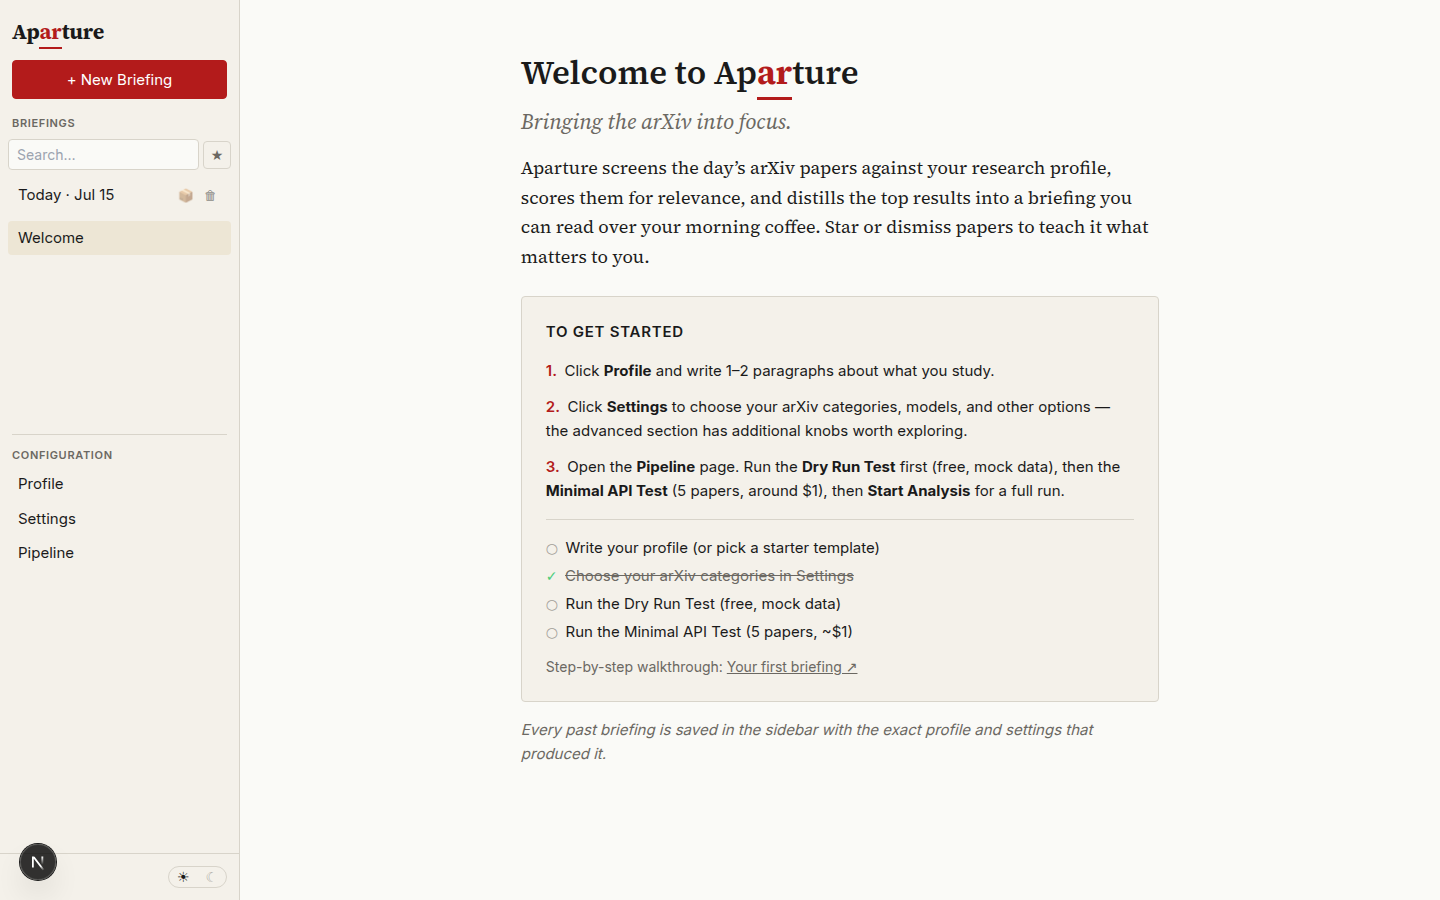
The welcome view greets a fresh install with a first-run checklist; items tick off as you complete them.
2. Pick a starter template, or write your own
Open the Profile view. On a fresh install a template picker sits at the top: four example profiles, each of which fills in the profile text and sets a matching arXiv category list in one click. Pick the one closest to your field — the focused single-subfield example is the best model for most people — or skip the picker entirely. The templates are examples, not defaults; the point is to see one full run work, then replace the text with your own research.
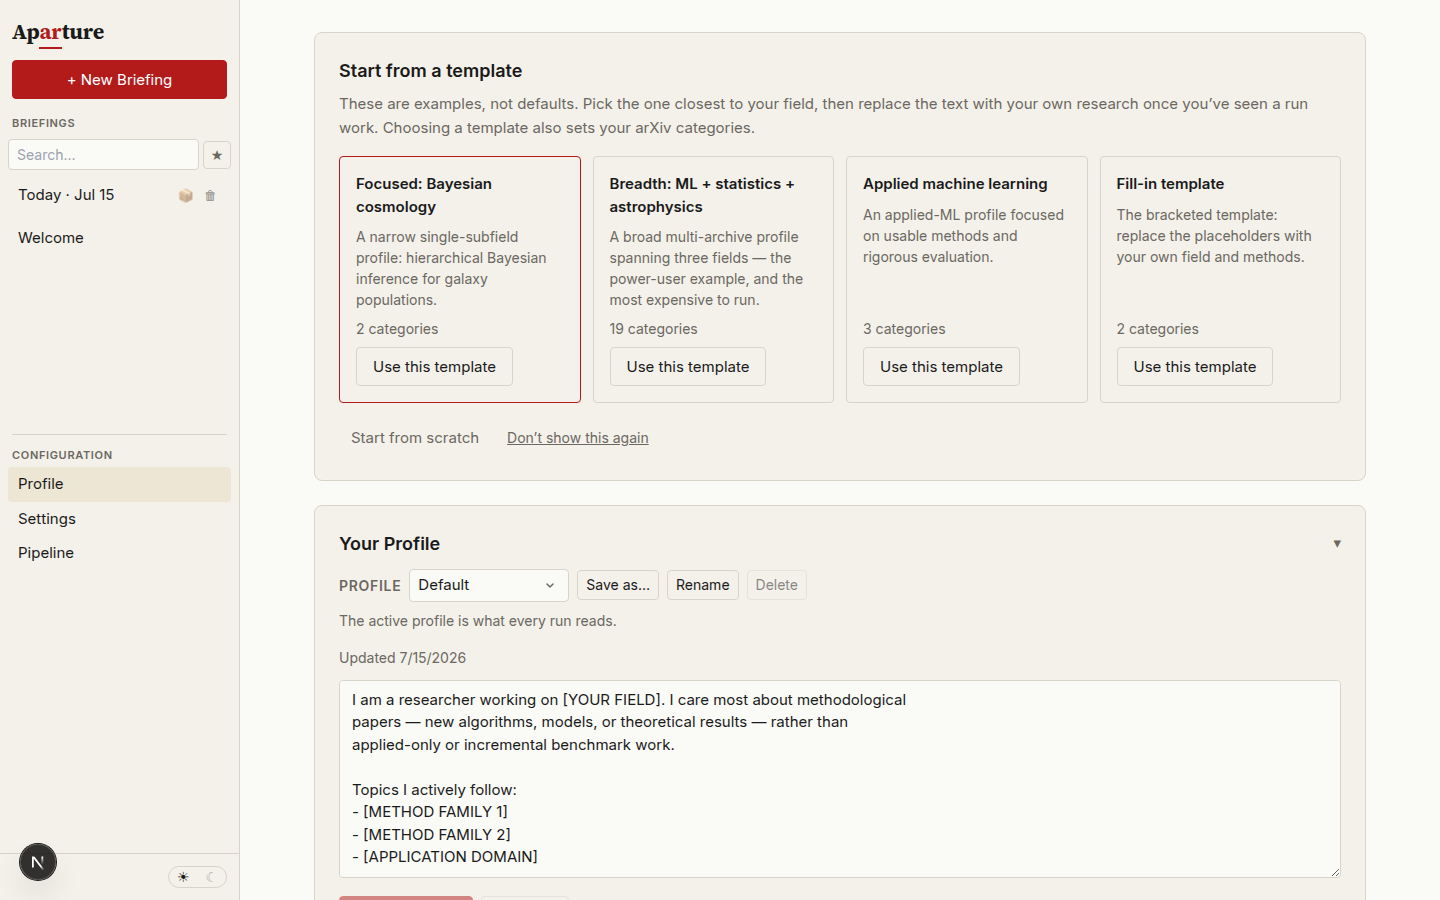
The starter template picker above the profile text box. It disappears once you save an edit or dismiss it.
Below the picker, the profile text box is the single source of what Aparture thinks you care about — every stage of the pipeline reads it, so a few minutes of thought here pays off across the rest of the run.
A first profile doesn't need to be polished. A couple of sentences describing your main research area, a handful of method families or application domains you actively follow, and a short list of things you're explicitly not interested in (the filter model leans heavily on negatives) is already enough to get useful output. The shipped fill-in template looks like this:
I am a researcher working on [YOUR FIELD]. I care most about methodological
papers — new algorithms, models, or theoretical results — rather than
applied-only or incremental benchmark work.

Topics I actively follow:
- [METHOD FAMILY 1]
- [METHOD FAMILY 2]
- [APPLICATION DOMAIN]

I have some interest in adjacent work that uses these methods in novel ways,
but less interest in pure applications of well-established techniques.

I'm not interested in:
- Purely empirical leaderboard papers with no methodological contribution
- Vision-only papers unless they introduce a broadly useful technique
- Engineering or systems work without a research angle
Edit the bracketed placeholders to match your actual work, then click Save changes. Writing a good profile is its own craft — Writing a good profile covers it in depth when you're ready, including the template list and how to keep several named profiles.
3. Check your categories and leave the models alone
Open the Settings view. Two things to check, one to leave alone, everything else to skip for now:
- ArXiv Categories — if you picked a starter template, its categories are already set and you can move on. Otherwise pick two or three to start:
cs.LG+stat.MLfor machine learning,cs.CL+cs.LGfor NLP,astro-ph.CO+astro-ph.IMfor astrophysics,stat.ME+stat.MLfor statistics. You can expand later once you see how many papers land on a typical day. If none of those match your field, see arXiv categories. - Model slots — match the slots to the provider key(s) you set up. Aparture ships with all-Google defaults (Flash-Lite for filter and quick summaries, Gemini 3.5 Flash for scoring, PDF analysis, and briefing), so a Google-only setup can leave them as-is. If you set up only an Anthropic or OpenAI key, switch the slots to that provider's recommended lineup — the tables on the Anthropic, Google, and OpenAI pages list exact picks. Mixing providers across slots works fine too, as long as every slot has a valid key. Model selection goes into the trade-offs.
Click back to the Pipeline view when you're done.
4. Start the run — and expect three pauses
The Pipeline view shows the Progress Timeline (six stages, all empty) next to a Start Analysis button. One thing worth knowing before you click it: the default run stops and waits for you three times along the way.
  1. Fetch papers
      │
  2. Filter papers      (YES / MAYBE / NO triage)
      │
      ⏸   Gate 1 — review the buckets, fix obvious errors
      │
  3. Score abstracts    (0–10 + justification)
  3.5. Post-process     (optional consistency pass)
      │
      ⏸   Gate 2 — review scores, star papers for deep analysis
      │
  4. Analyze PDFs       (full-text read of the top N)
      │
      ⏸   Gate 3 — star / dismiss / comment on analysed papers
      │
  5. Briefing           (editorial synthesis + hallucination audit)
All three pauses are on by default and can be turned off in Settings → Review & confirmation once you've seen a few runs. For this run, clicking through them without much ceremony is fine — the point this time is to notice where they fire and what they show.
Click Start Analysis.
5. Fetch and filter, then the first pause
The timeline lights up stage-by-stage. The first two run without intervention:
- Fetch papers — the arXiv API query runs against your categories.
- Filter papers — the filter model reads each paper's abstract and triages it as YES, MAYBE, or NO, batched and parallelised for speed.
When the filter finishes, the pipeline parks at its first review gate. The main area shows three buckets of papers, each card carrying a one-sentence summary and a short justification, plus a clickable verdict button you can use to move the paper between buckets.
Take a minute to scan what landed where. If something you'd clearly want is in NO, click its pill to move it to MAYBE or YES; similarly if something in YES is obviously a miss. Every override gets logged as a filter-override feedback event, which reroutes that paper to scoring on this run and also feeds the Suggest Improvements flow later on.
First-run habit
A quick scan is plenty on this run. If something's obviously in the wrong bucket, click its verdict button to move it; if not, Continue to scoring → is perfectly fine. The filter's blind spots tend to become clearer after you've seen a few runs — today, mostly what matters is knowing the gate exists and seeing what it shows you.
6. Scoring, then the second pause
The pipeline moves through abstract scoring and an optional post-processing consistency pass, then parks at its second review gate — "Score review" with a Continue to PDF analysis → button — before any PDF is read. This is the cheapest moment to adjust which papers get the expensive full-text treatment.
The scored list appears in three groups: the top-N papers that will be PDF-analysed as things stand, a borderline band just below the cutoff, and everything else. Each row carries a STAR button (guarantees the paper gets PDF-analysed regardless of its score) and a DISMISS button (drops it from the PDF set for this run). A free-text "feedback on this scoring round" field takes observations about the round as a whole.
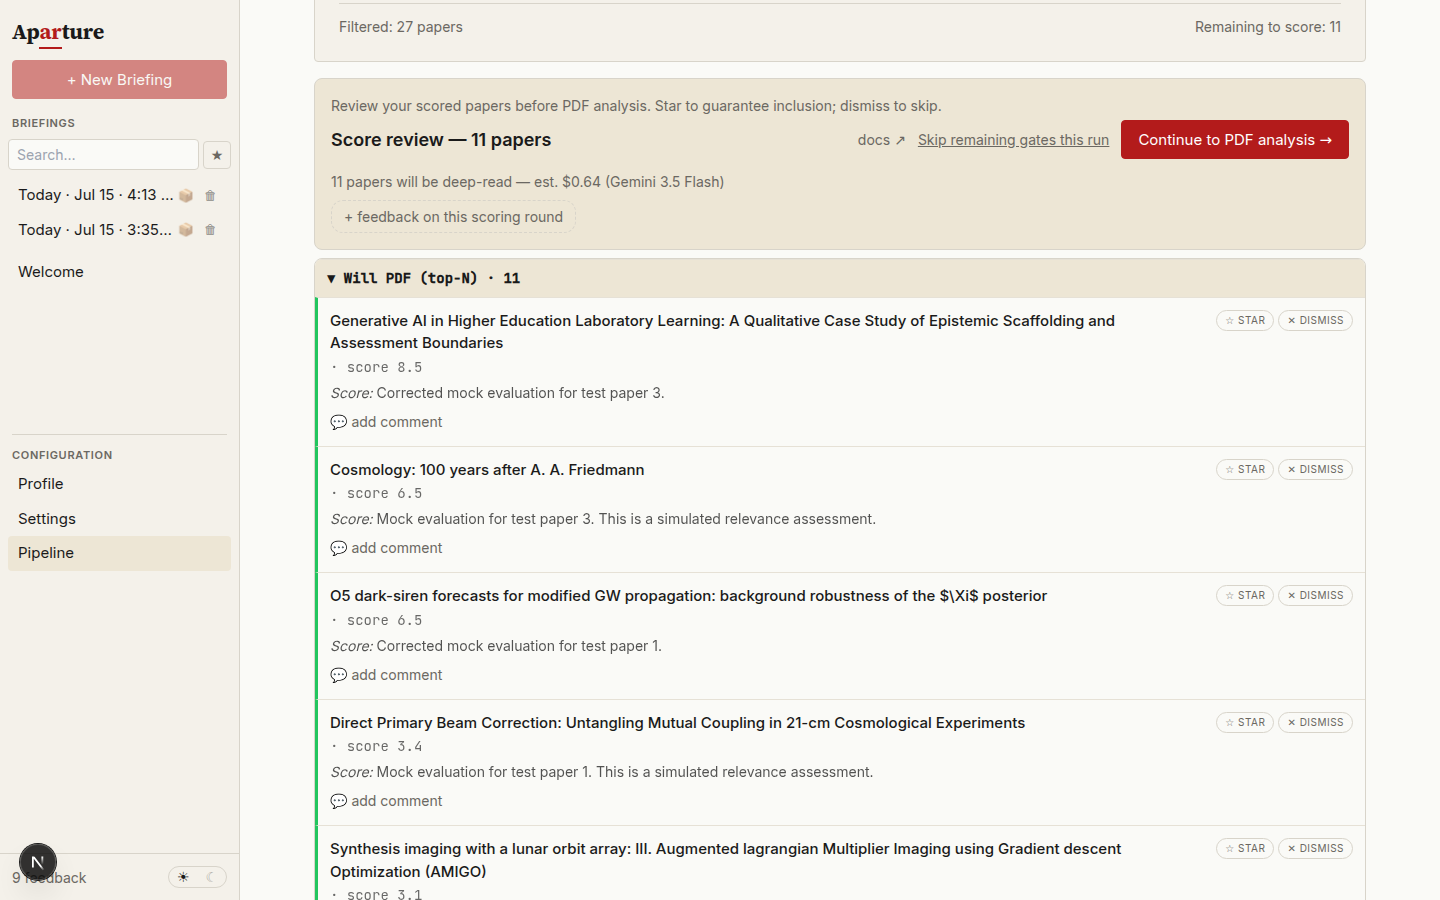
The score-review gate. The banner estimates the cost of the PDF stage it holds back; STAR and DISMISS on each row adjust which papers get the full-text read.
On this first run, a quick skim of the top group is plenty — click Continue to PDF analysis → when the list looks reasonable. Review gates covers the selection logic when you want to steer it deliberately.
7. PDF analysis
Stage 4 reads the selected papers in full. PDF analysis is the slowest stretch of the run by some margin — each paper is downloaded, read, and summarised, with the analyses running in parallel in the background. How long it takes varies with how many papers passed the filter, which model you're using for PDFs, and your provider tier.
This is a good point to step away from the browser for a bit. The timeline and activity log continue updating as each stage completes, and the run survives browser navigation, so you can switch tabs or come back later without losing progress.
8. Third pause — before the briefing writes
Once PDF analysis finishes, the pipeline parks at its third review gate with the Analysis Results rendered in the main area. Each paper card carries three feedback controls:
- ☆ star — marks the paper as important. The eventual briefing will give it richer treatment and more prominent placement.
- ⊘ dismiss — marks it as uninteresting. The briefing will deprioritise it.
- + comment — a short note that gets woven into the paper's write-up in the briefing.
You'll also notice a Download Report card
A Download Report card appears alongside the results at this gate, and it's tempting to treat it as the final output of the run. It isn't. The report is a flat markdown compile of the per-paper deep analyses — a long, detail-heavy technical document, useful for archiving or sharing, but not the editorial reading view most daily use revolves around. The briefing comes next, after this pause. See The Download Report vs the briefing for what's in each and why they exist.
On this first run, skim the results and click Continue to briefing → without starring or dismissing anything. The feedback controls are where Aparture becomes useful over weeks, not one run; Giving feedback covers what each one actually does downstream when you want to engage with them deliberately.
9. Read what you got
Once synthesis completes, Aparture saves the new briefing to the sidebar archive and switches the main area to its reading view — the briefing opens on its own page rather than appearing below what you were just looking at. You can always flip back to the run results via the Pipeline nav link, but the briefing view is where most of the useful output lives.
Four blocks are worth recognising across the two views:
| Block | Where it lives | What it is |
|---|---|---|
| Analysis Results | Pipeline view | Ranked paper list with scores (0.0–10.0, see how scoring works), justifications, and deep summaries — still interactive |
| Download Report | Pipeline view | Markdown compile of the per-paper deep analyses (see report vs briefing) |
| Briefing | Briefing view (archived) | Editorial reading surface — executive summary, themes, paper cards |
| NotebookLM | Briefing view | Optional podcast bundle generator, see Generating a podcast |
Expect the first briefing to be rough
The filter model hasn't seen any of your feedback yet, your profile is a sketch rather than a honed description, and you didn't give feedback at any of the gates. That's all fine — the feedback loop sharpens across runs, and that's really what the rest of the Guide is about.
Next
Reading a briefing → — decoding what each section of the editorial view actually means, and how the voice behaves. Good to read before your second run.
Also worth reading:
- Giving feedback — what stars, dismisses, comments, and filter overrides actually do to the next run.
- Writing a good profile — rewriting the starter template once you know what you want.
- Refining over time — when to use Suggest Improvements to let the tool propose profile edits from accumulated feedback.
If the run failed anywhere — no papers fetched, a stage 429'd, a PDF download blocked — the troubleshooting page groups symptoms by stage, and Verify setup has the two sanity-check buttons if you want to isolate whether it's the pipeline or your configuration.