
Concepts / Selection
Selection
Your catalogue is missing objects. When does that bias the population, and what does binference need to correct it?
Which objects are missing
Few catalogues contain every object. A survey misses faint galaxies, a detector misses quiet events, a screening misses mild cases. The selection \(S_k\) is the probability that an object whose true value lies in bin \(k\) enters the catalogue.
If \(S_k\) is the same in every bin, the catalogue is a fair sample and the fractions need no correction. If it varies, the catalogue over-represents the bins that are easy to observe. Ignoring that biases \(\rho\) toward them.
On the truth or on the measurement
What matters is what the selection acts on, its selection mode (the modes figure):
On the truth. The chance of being kept depends on the true value \(z\) alone, not on the measurement noise. A selection that depends on true planet radius is an example. binference then multiplies each object’s likelihood by \(S_k\).
On the measurement. The cut acts on the measured data \(d\), such as a limit on measured flux. An object near the cut is kept or lost depending on its noise. The likelihood of a kept object is used as it is. Here \(S_k\) is the chance that an object in bin \(k\) would pass the cut, averaged over its possible data.
The two modes give different likelihoods for the same \(S_k\), so binference asks you to state the mode with every selection. A selection can also act on both at once.
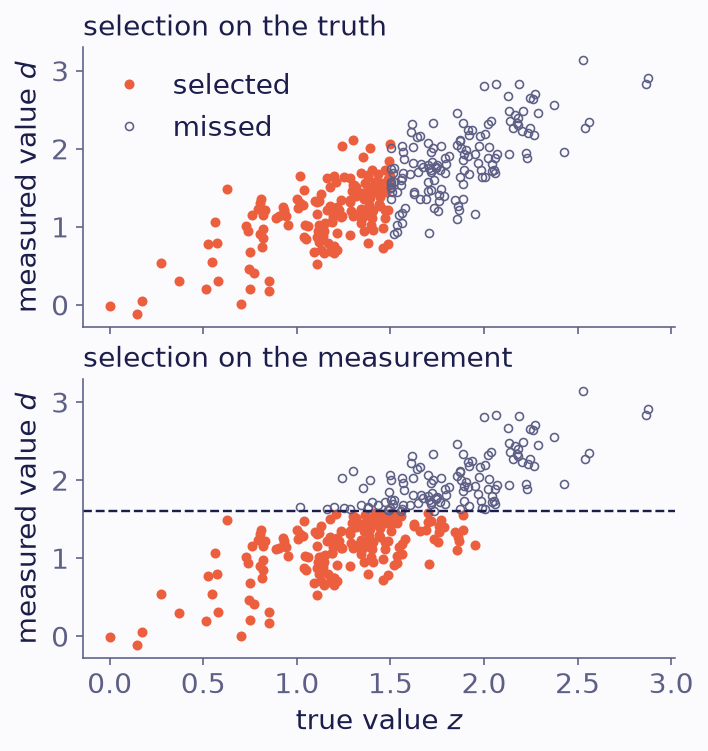
300 mock objects with true values \(z\). Their measured values \(d\) have Gaussian errors of 0.3. Top: each object is kept with a probability that falls from one to zero around \(z=1.5\). Bottom: objects with \(d\) above 1.6 (dashed line) are missed. Filled: selected. Open: missed.
The normaliser
A selected object tells you about the population of objects that could be selected, not about the whole population. The share of the population that is selected is
the area under the selected part of the population (the normaliser figure). binference divides each object’s term in the likelihood by this selected share.
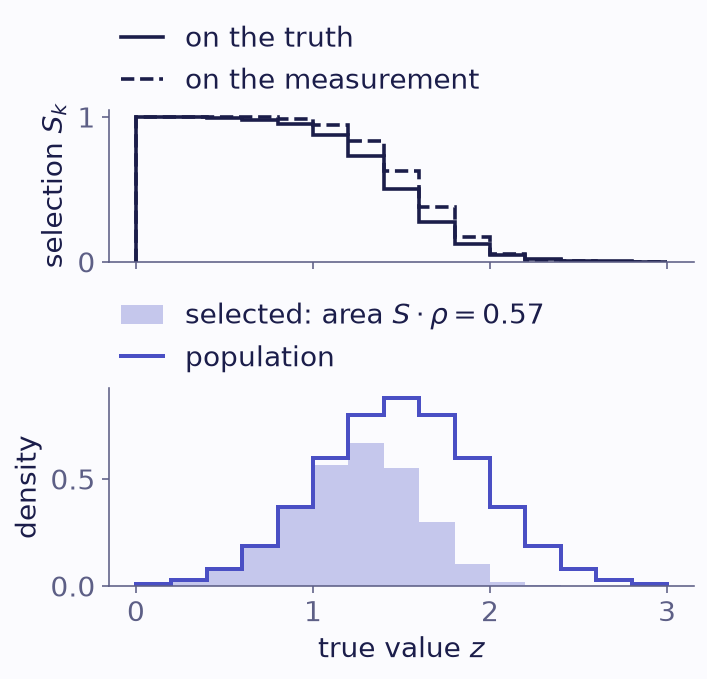
Top: the selection \(S_k\) of the two examples above, on 15 bins, computed by binference. One comes from a smooth selection on the truth, the other from the cut at \(d=1.6\). Bottom: the population (outline) and its part selected by the cut (shaded). The shaded area is \(S\cdot\rho\).
The pitfalls guide describes the two common mistakes with the normaliser.
For the fractions, only the ratios of the \(S_k\) matter. A selection known only up to a constant is enough.
Rates and totals
The normaliser also answers a second question: how many objects were there in all? Suppose \(W\) objects are selected, a share \(S\cdot\rho\) of the population. Then the population held about \(W/(S\cdot\rho)\) objects. For every draw of \(\rho\), binference draws the total \(\Lambda\): the expected number of objects, including those the selection missed. The rates \(\lambda_k=\Lambda\rho_k\) are the expected numbers per bin.
The total needs absolute values of \(S_k\). An exposure, such as observing time times area, can take the place of a probability, and then the rates are numbers per unit exposure. A prior on the rates themselves replaces the prior on the fractions when you have prior knowledge of the counts.
In plain words
If some objects are easier to find, your catalogue has too many of them. Tell binference how likely each kind of object was to be found, and whether the cut was on the true value or on the measurement.
Where next
Do it: the selection guide, including selections that vary within bins and selections measured by injections.
See it: the tutorial Selection effects and rates.
Derivation: selection effects in How it works.