Tutorial 2: Stellar Population Models
Isochrone and StellarPop model coeval stellar populations across age, metallicity, initial mass function (IMF), and binary fraction.
Topics Covered
Isochrone class for coeval stellar populations
StellarPop for population synthesis
Age and metallicity sequences
IMF sampling and mass functions
Synthetic cluster generation
Prerequisites
The setup cell below checks the data files this tutorial needs; Tutorial 00 shows how to download them.
# Optional: Download required data files (only needed if not already cached)
# This tutorial requires MIST isochrones and the C3K neural network.
# Uncomment the lines below to download them.

# from brutus.data import fetch_isos, fetch_nns
# fetch_isos()
# fetch_nns()
# Imports and setup
import numpy as np
import matplotlib.pyplot as plt
import warnings
warnings.filterwarnings('ignore')

from tutorial_utils import (
    setup_tutorial,
    print_saved_files,
    find_brutus_data_file,
    save_figure as _save_fig,
    print_section,
)

info = setup_tutorial(2, title="Tutorial 02: Stellar Population Models")


def save_figure(fig, name):
    """Save figure to this tutorial's plot directory."""
    _save_fig(fig, 2, name)
Section 1: Understanding Isochrones
Isochrones model populations of stars born at the same time with the same composition. They are fundamental for understanding star clusters and stellar populations in galaxies.
Key Concepts
Isochrone: A line in the HR diagram connecting stars of the same age and composition but different masses
Coeval population: All stars formed at the same time (e.g., star clusters)
EEP grid: Equivalent Evolutionary Points provide consistent sampling across different masses
from brutus.core import Isochrone
from brutus.data import filters

# Initialize Isochrone
mistfile = find_brutus_data_file('MIST_1.2_iso_vvcrit0.0.h5')

# Note: Isochrone doesn't take nnfile or filters as arguments
iso = Isochrone(mistfile=mistfile, verbose=False)

print(f"Loaded isochrones")
print(f"  Age range: {iso.loga_grid.min():.1f} - {iso.loga_grid.max():.1f} log(years)")
print(f"  Metallicity range: {iso.feh_grid.min():.2f} - {iso.feh_grid.max():.2f}")
print(f"  Available predictions: {iso.predictions}")
Loaded isochrones
  Age range: 5.0 - 10.3 log(years)
  Metallicity range: -4.00 - 0.50
  Available predictions: ['mini', 'mass', 'logl', 'logt', 'logr', 'logg', 'feh_surf', 'afe_surf']
# Generate a sample isochrone
# Set EEP grid (covers full evolution)
eep_grid = np.linspace(202, 808, 2000)

# Generate isochrone parameters
params_arr = iso.get_predictions(feh=0.0, afe=0.0, loga=9.0, eep=eep_grid)

# Convert to structured array for easier access
params = {}
for i, label in enumerate(iso.predictions):
    params[label] = params_arr[:, i]

# Find valid points (where mass exists)
valid = np.isfinite(params['mini'])
print(f"  Valid EEP points: {valid.sum()}/{len(eep_grid)}")
print(f"  Mass range: {params['mini'][valid].min():.2f} - {params['mini'][valid].max():.2f} M☉")

# Show some example stellar parameters
print("\nExample stellar parameters along isochrone:")
for i in [100, 500, 900, 1300]:
    if i < len(params['mini']) and np.isfinite(params['mini'][i]):
        print(f"  Star {i}: M={params['mini'][i]:.2f} M☉, "
              f"Teff={10**params['logt'][i]:.0f} K, "
              f"L={10**params['logl'][i]:.2f} L☉")
  Valid EEP points: 2000/2000
  Mass range: 0.14 - 2.29 M☉

Example stellar parameters along isochrone:
  Star 100: M=0.35 M☉, Teff=3312 K, L=0.02 L☉
  Star 500: M=1.77 M☉, Teff=7704 K, L=14.07 L☉
  Star 900: M=2.05 M☉, Teff=6323 K, L=37.01 L☉
  Star 1300: M=2.07 M☉, Teff=4397 K, L=169.89 L☉
Section 2: StellarPop for Population Synthesis
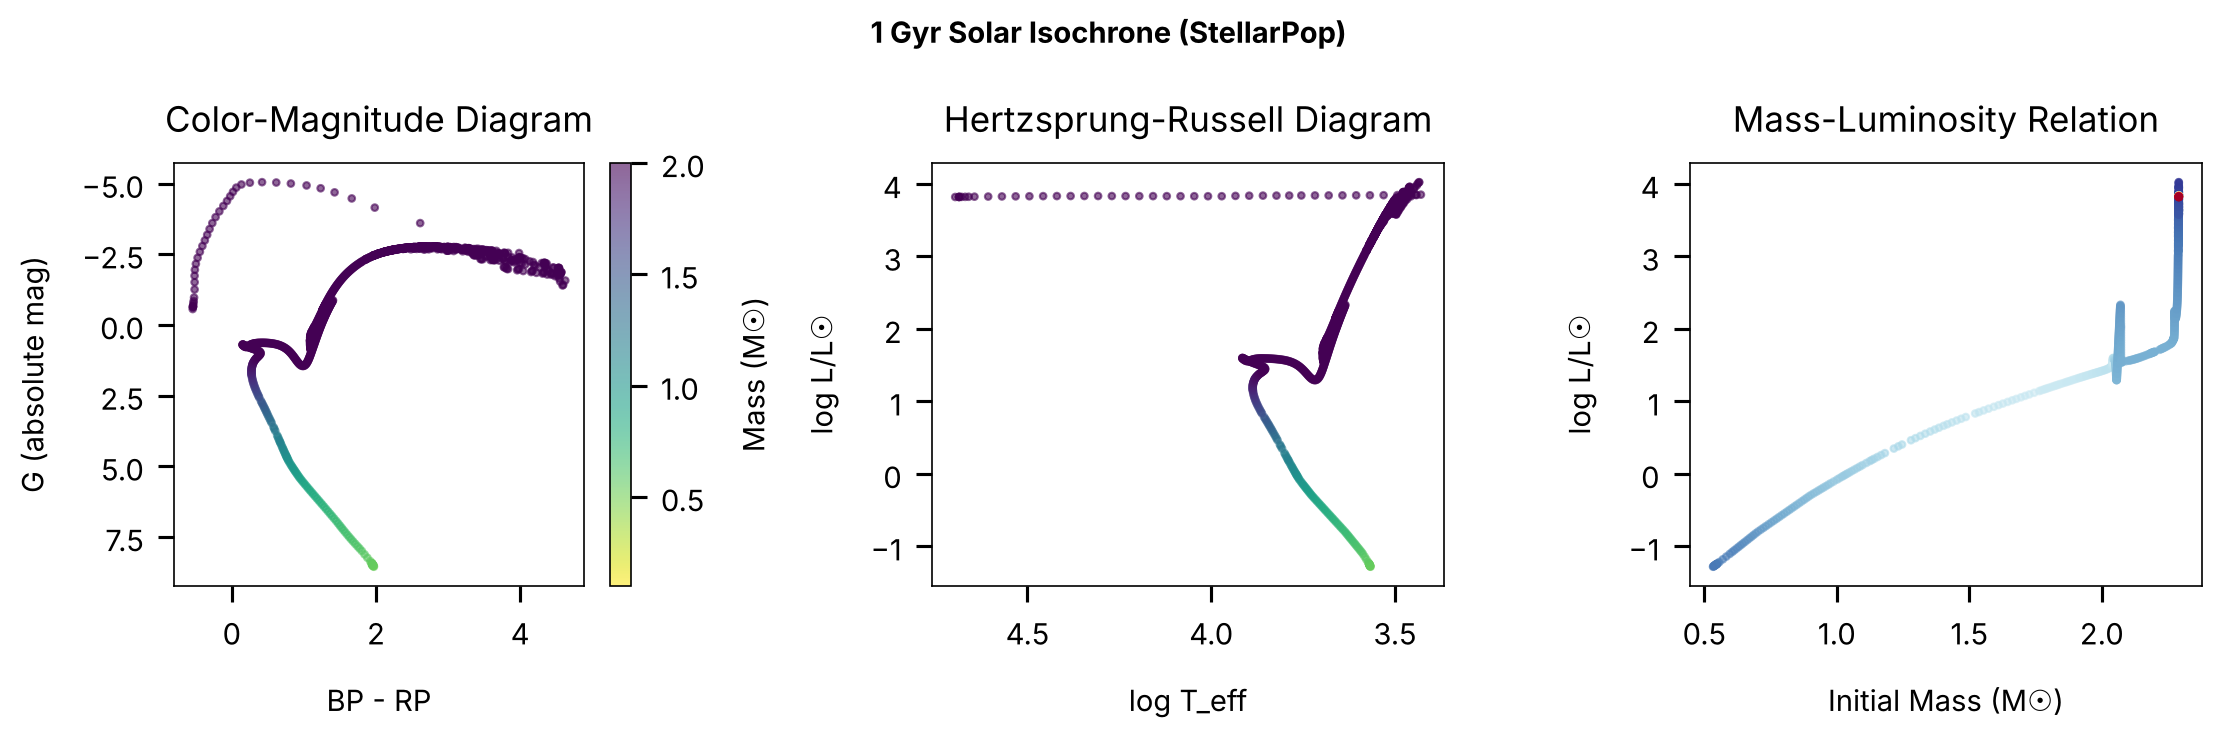
StellarPop generates synthetic stellar populations by sampling from an IMF and computing population-level photometry including binaries.
Key Features
Combines Isochrone predictions with neural network photometry
Handles binary star populations
Applies extinction and distance effects
Generates realistic synthetic clusters
from brutus.core import StellarPop

# Initialize StellarPop with photometric filters
nnfile = find_brutus_data_file('nn_c3k.h5')
filt = filters.gaia + filters.ps[:3]

print(f"Using filters: {', '.join(filt)}")

# Create StellarPop instance
pop = StellarPop(isochrone=iso, filters=filt, nnfile=nnfile, verbose=False)

print("StellarPop initialized")
Using filters: Gaia_G_MAW, Gaia_BP_MAWf, Gaia_RP_MAW, PS_g, PS_r, PS_i
StellarPop initialized
# Evaluate isochrone SEDs
# Isochrone parameters
feh, afe, loga = 0.0, 0.0, 9.0  # Solar metallicity, 1 Gyr
av, rv, dist = 0.0, 3.32, 10.0   # 10 pc (absolute mags), no extinction

# Generate photometry for all EEP points along the isochrone
# Note: get_seds returns one SED per EEP point, not an IMF-sampled population
mags, params, binary_params = pop.get_seds(
    feh=feh, afe=afe, loga=loga,
    av=av, rv=rv, dist=dist,
    binary_fraction=0.0
)

# Filter to valid (finite) models
valid = np.all(np.isfinite(mags), axis=1) & np.isfinite(params['mini'])
print(f"Evaluated {len(mags)} EEP points, {valid.sum()} with valid photometry")
print(f"  Mass range: {params['mini'][valid].min():.2f} - {params['mini'][valid].max():.2f} M☉")

# Show magnitude statistics
print("\nMagnitude statistics (valid models at 10 pc):")
for i, f in enumerate(filt):
    vals = mags[valid, i]
    print(f"  {f}: {np.median(vals):.1f} (range {vals.min():.1f} to {vals.max():.1f}) mag")
Evaluated 1710 EEP points, 1206 with valid photometry
  Mass range: 0.53 - 2.29 M☉

Magnitude statistics (valid models at 10 pc):
  Gaia_G_MAW: -2.0 (range -5.0 to 8.6) mag
  Gaia_BP_MAWf: -0.1 (range -4.9 to 9.6) mag
  Gaia_RP_MAW: -3.3 (range -5.5 to 7.6) mag
  PS_g: 0.2 (range -5.0 to 9.9) mag
  PS_r: -0.8 (range -5.0 to 8.8) mag
  PS_i: -2.6 (range -5.1 to 8.0) mag
# Visualize the isochrone
fig, axes = plt.subplots(1, 3, figsize=(15, 5))

# Panel 1: Gaia CMD
ax = axes[0]
bp_rp = mags[valid, 1] - mags[valid, 2]
g_mag = mags[valid, 0]
mini_valid = params['mini'][valid]

scatter = ax.scatter(bp_rp, g_mag, c=mini_valid, s=10,
                    cmap='viridis_r', vmin=0.1, vmax=2.0, alpha=0.6)
ax.set_xlabel('BP - RP')
ax.set_ylabel('G (absolute mag)')
ax.set_title('Color-Magnitude Diagram')
ax.invert_yaxis()
plt.colorbar(scatter, ax=ax, label='Mass (M☉)')

# Panel 2: HRD (with validity filter)
ax = axes[1]
hrd_valid = valid & np.isfinite(params['logt']) & np.isfinite(params['logl'])
ax.scatter(params['logt'][hrd_valid], params['logl'][hrd_valid],
          c=params['mini'][hrd_valid], s=10,
          cmap='viridis_r', vmin=0.1, vmax=2.0, alpha=0.6)
ax.set_xlabel('log T_eff')
ax.set_ylabel('log L/L☉')
ax.set_title('Hertzsprung-Russell Diagram')
ax.invert_xaxis()

# Panel 3: Mass-Luminosity relation
ax = axes[2]
ax.scatter(params['mini'][hrd_valid], params['logl'][hrd_valid],
          c=params['logt'][hrd_valid], s=10,
          cmap='RdYlBu_r', alpha=0.6)
ax.set_xlabel('Initial Mass (M☉)')
ax.set_ylabel('log L/L☉')
ax.set_title('Mass-Luminosity Relation')

plt.suptitle('1 Gyr Solar Isochrone (StellarPop)', fontsize=14, fontweight='bold')
plt.tight_layout()
save_figure(fig, 'stellarpop_isochrone')
plt.show()
Section 3: Isochrone Age Sequences
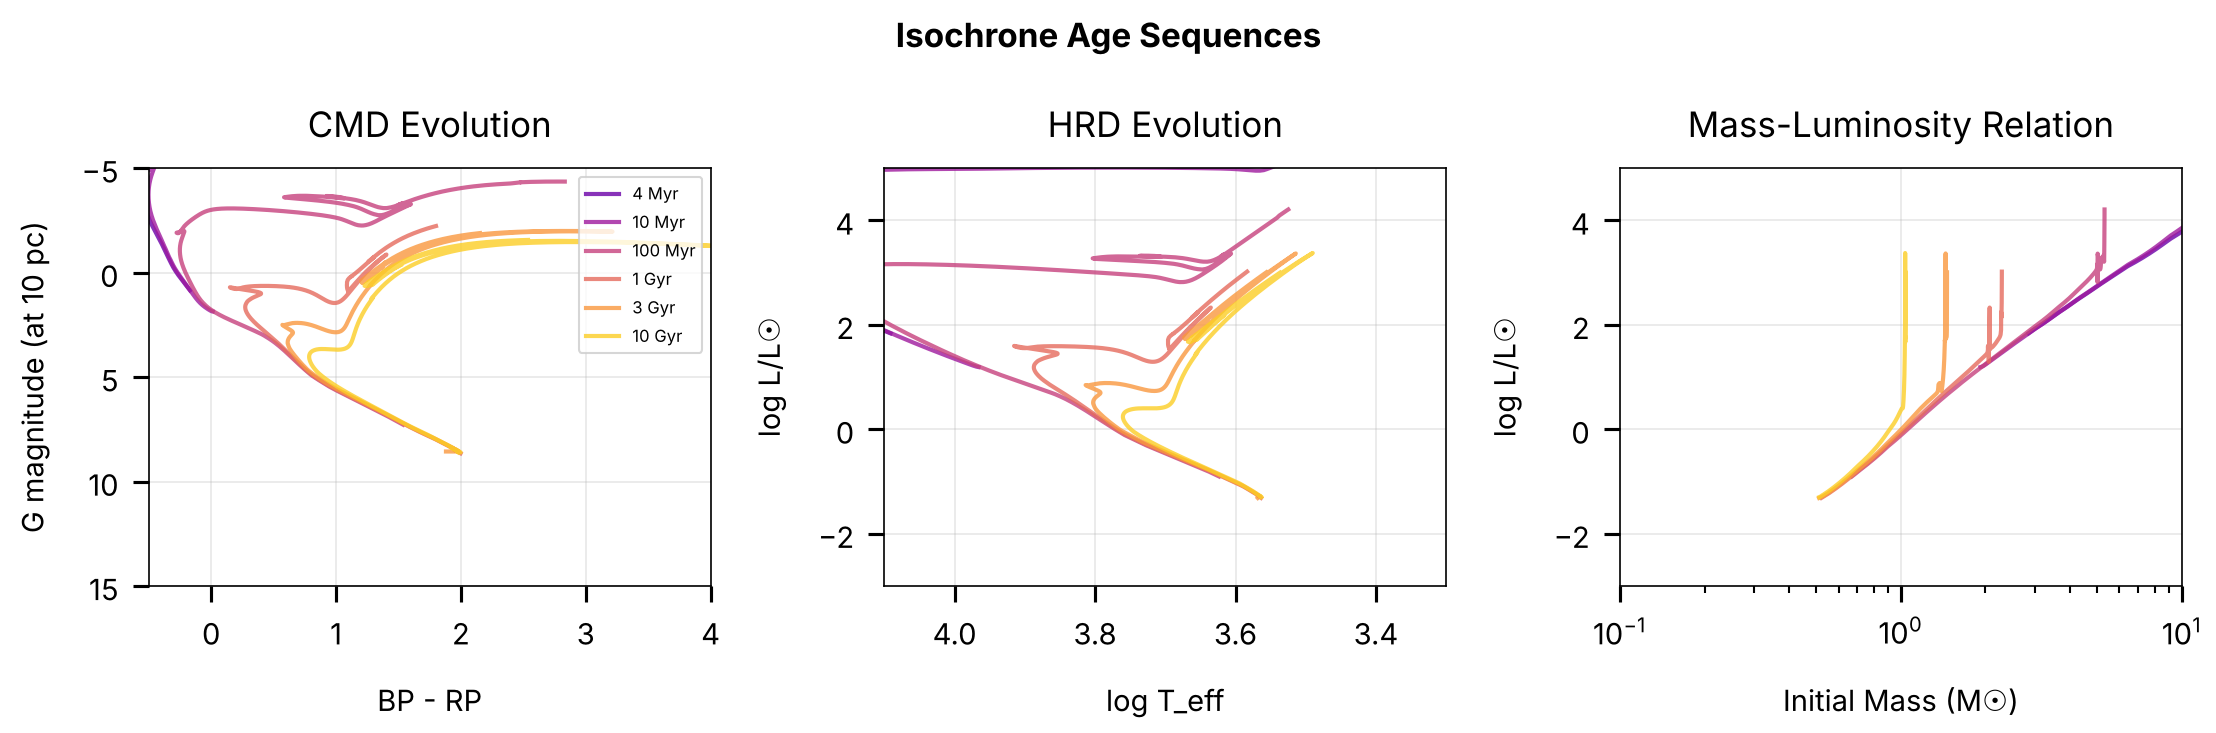
Stellar populations evolve with time as stars leave the main sequence. Let’s explore how isochrones change with age.
Age Effects
Main sequence turnoff moves to lower masses with age
Red giant branch develops for older populations
Horizontal branch appears in old, metal-poor populations
Color distribution becomes redder with age
# Create age sequence plots
fig, axes = plt.subplots(1, 3, figsize=(15, 5))

# Age grid (log years)
ages = [6.6, 7.0, 8.0, 9.0, 9.5, 10.0]  # 4 Myr to 10 Gyr
age_labels = ['4 Myr', '10 Myr', '100 Myr', '1 Gyr', '3 Gyr', '10 Gyr']
colors = plt.cm.plasma(np.linspace(0.2, 0.9, len(ages)))

# Fixed metallicity
feh, afe = 0.0, 0.0
eep_grid = np.linspace(202, 808, 2000)

for loga, label, color in zip(ages, age_labels, colors):
    # Generate isochrone stellar parameters
    params_arr = iso.get_predictions(feh=feh, afe=afe, loga=loga, eep=eep_grid)
    params = {label: params_arr[:, i] for i, label in enumerate(iso.predictions)}

    # Get magnitudes using StellarPop
    mags, _, _ = pop.get_seds(feh=feh, afe=afe, loga=loga, eep=eep_grid,
                               dist=10.0, binary_fraction=0.0)

    # Valid points
    valid = np.isfinite(params['mini']) & np.isfinite(mags[:, 0])

    # Panel 1: CMD
    bp_rp = mags[valid, 1] - mags[valid, 2]
    g_mag = mags[valid, 0]
    axes[0].plot(bp_rp, g_mag, color=color, lw=2, alpha=0.8, label=label)

    # Panel 2: HRD
    axes[1].plot(params['logt'][valid], params['logl'][valid],
                   color=color, lw=2, alpha=0.8)

    # Panel 3: Mass-Luminosity
    axes[2].plot(params['mini'][valid], params['logl'][valid],
                   color=color, lw=2, alpha=0.8)


# Format all plots
axes[0].set_xlabel('BP - RP')
axes[0].set_ylabel('G magnitude (at 10 pc)')
axes[0].set_title('CMD Evolution')
axes[0].invert_yaxis()
axes[0].set_xlim(-0.5, 4.0)
axes[0].set_ylim(15, -5)
axes[0].legend(fontsize=8, loc='upper right')
axes[0].grid(True, alpha=0.3)

axes[1].set_xlabel('log T_eff')
axes[1].set_ylabel('log L/L☉')
axes[1].set_title('HRD Evolution')
axes[1].invert_xaxis()
axes[1].set_xlim(4.1, 3.3)
axes[1].set_ylim(-3, 5)
axes[1].grid(True, alpha=0.3)

axes[2].set_xlabel('Initial Mass (M☉)')
axes[2].set_ylabel('log L/L☉')
axes[2].set_title('Mass-Luminosity Relation')
axes[2].set_xscale('log')
axes[2].set_xlim(0.1, 10)
axes[2].set_ylim(-3, 5)
axes[2].grid(True, alpha=0.3)

plt.suptitle('Isochrone Age Sequences', fontsize=16, fontweight='bold')
plt.tight_layout()
save_figure(fig, 'age_sequences')
plt.show()
Section 4: Metallicity Effects on Stellar Populations
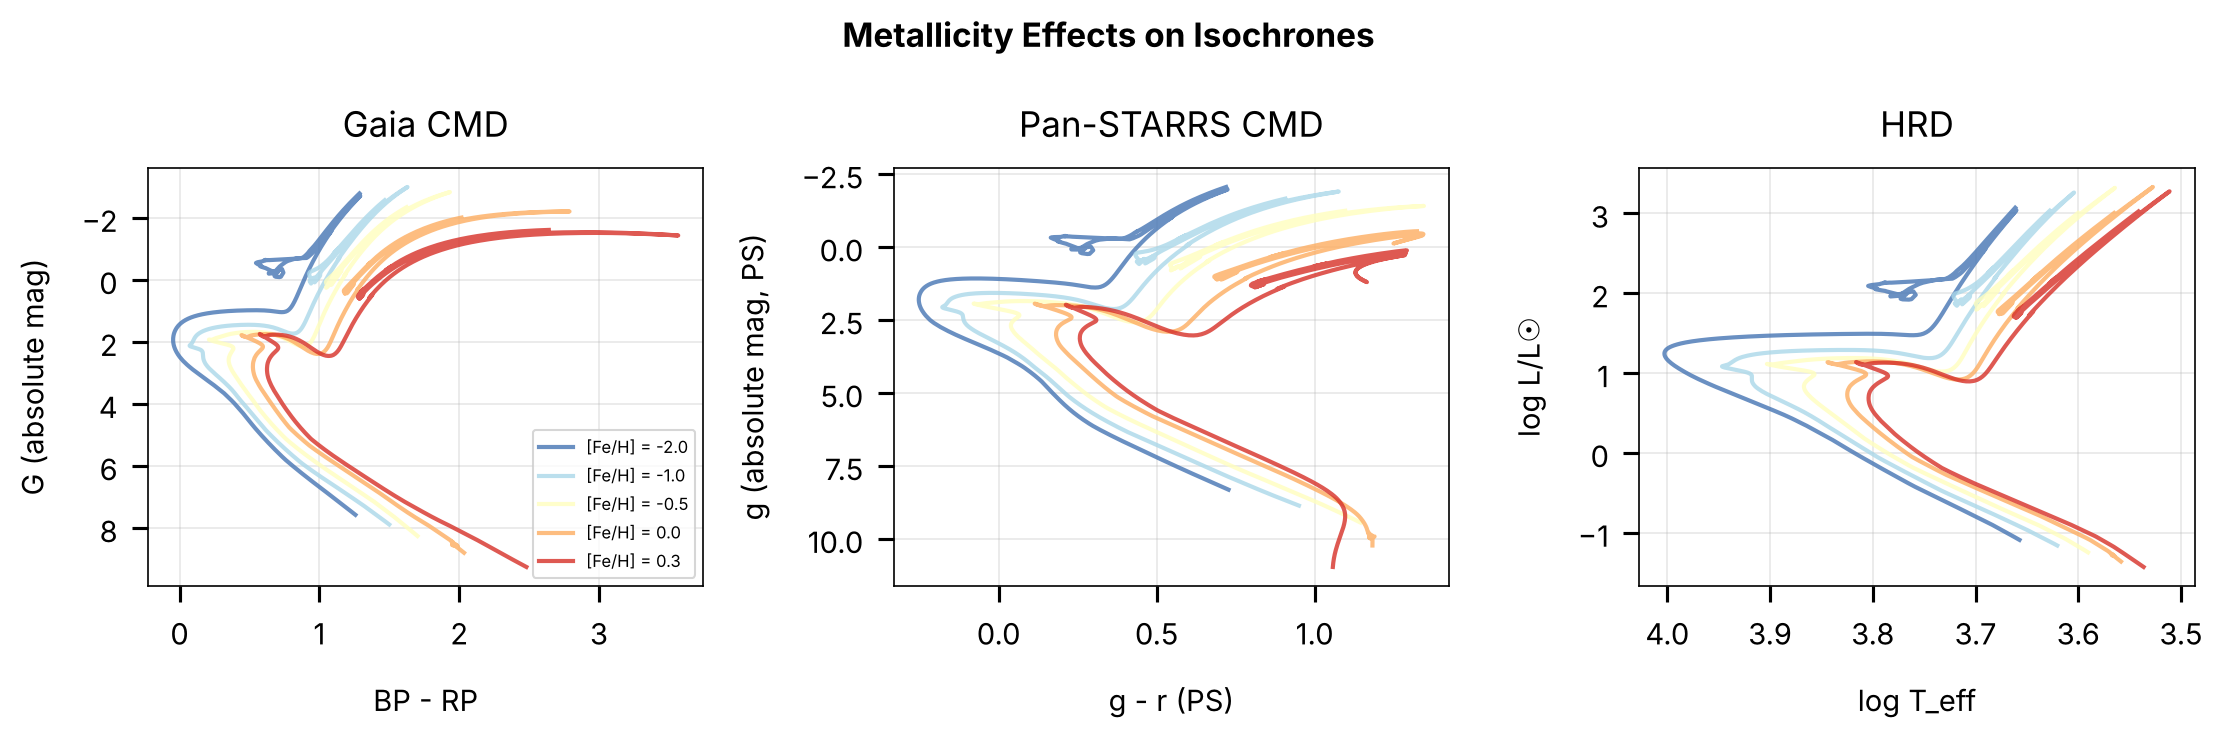
Metallicity profoundly affects stellar populations, changing their colors, luminosities, and evolutionary timescales.
Metallicity Effects
Metal-poor stars are bluer and hotter at fixed mass
RGB position is sensitive to metallicity
Main sequence width increases with metallicity spread
Galactic components have distinct metallicity distributions
# Create metallicity comparison plots
fig, axes = plt.subplots(1, 3, figsize=(15, 5))

# Metallicity grid
feh_values = [-2.0, -1.0, -0.5, 0.0, 0.3]
colors = plt.cm.RdYlBu_r(np.linspace(0.1, 0.9, len(feh_values)))

# Fixed age, use absolute magnitudes (10 pc)
loga, afe = 9.3, 0.0  # 2 Gyr
eep_grid = np.linspace(202, 808, 2000)

for feh, color in zip(feh_values, colors):
    # Generate isochrone
    params_arr = iso.get_predictions(feh=feh, afe=afe, loga=loga, eep=eep_grid)
    params = {label: params_arr[:, i] for i, label in enumerate(iso.predictions)}

    # Get magnitudes at 10 pc (absolute)
    mags, _, _ = pop.get_seds(feh=feh, afe=afe, loga=loga, eep=eep_grid,
                              dist=10.0, binary_fraction=0.0)

    # Valid points
    valid = np.isfinite(params['mini']) & np.all(np.isfinite(mags), axis=1)

    # Panel 1: Gaia CMD
    bp_rp = mags[valid, 1] - mags[valid, 2]
    g_mag = mags[valid, 0]
    axes[0].plot(bp_rp, g_mag, color=color, lw=2, alpha=0.8,
                   label=f'[Fe/H] = {feh:.1f}')

    # Panel 2: PS CMD
    g_ps = mags[valid, 3]  # PS g
    r_ps = mags[valid, 4]  # PS r
    axes[1].plot(g_ps - r_ps, g_ps, color=color, lw=2, alpha=0.8)

    # Panel 3: HRD
    hrd_valid = valid & np.isfinite(params['logt']) & np.isfinite(params['logl'])
    axes[2].plot(params['logt'][hrd_valid], params['logl'][hrd_valid],
                   color=color, lw=2, alpha=0.8)


# Format plots
axes[0].set_xlabel('BP - RP')
axes[0].set_ylabel('G (absolute mag)')
axes[0].set_title('Gaia CMD')
axes[0].invert_yaxis()
axes[0].legend(fontsize=8)
axes[0].grid(True, alpha=0.3)

axes[1].set_xlabel('g - r (PS)')
axes[1].set_ylabel('g (absolute mag, PS)')
axes[1].set_title('Pan-STARRS CMD')
axes[1].invert_yaxis()
axes[1].grid(True, alpha=0.3)

axes[2].set_xlabel('log T_eff')
axes[2].set_ylabel('log L/L☉')
axes[2].set_title('HRD')
axes[2].invert_xaxis()
axes[2].grid(True, alpha=0.3)

plt.suptitle('Metallicity Effects on Isochrones', fontsize=16, fontweight='bold')
plt.tight_layout()
save_figure(fig, 'metallicity_populations')
plt.show()
Section 5: IMF Sampling and Mass Functions
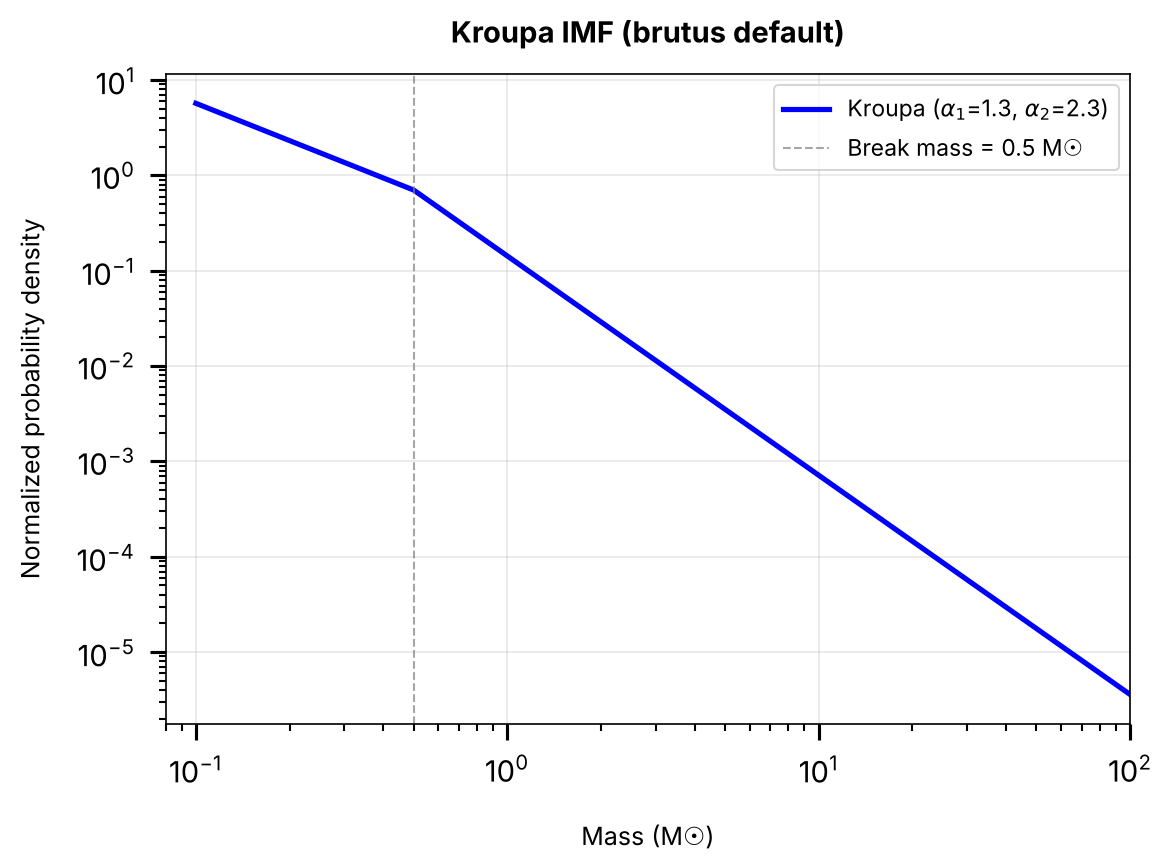
The Initial Mass Function (IMF) determines the distribution of stellar masses in a population.
Kroupa IMF
brutus implements a Kroupa (2001) broken power-law IMF via logp_imf.
This is a two-segment power law with a shallower slope at low masses
(below the break mass) and a steeper slope at high masses:
Low mass (M ≤ 0.5 M☉): α = 1.3
High mass (M > 0.5 M☉): α = 2.3
The break mass, slopes, and mass limits are all configurable parameters
of logp_imf.
from brutus.priors.stellar import logp_imf

# Kroupa IMF: normalized mass function
fig, ax = plt.subplots(figsize=(8, 6))

mass_grid = np.logspace(-1, 2, 1000)

# Default Kroupa IMF (broken power law)
kroupa_lnp = logp_imf(mass_grid, alpha_low=1.3, alpha_high=2.3, mass_break=0.5)
kroupa_pdf = np.exp(kroupa_lnp)
# np.trapezoid on NumPy 2.x (np.trapz was removed); np.trapz on 1.x
trapezoid = getattr(np, 'trapezoid', getattr(np, 'trapz', None))
kroupa_pdf /= trapezoid(kroupa_pdf, mass_grid)  # Normalize

ax.plot(mass_grid, kroupa_pdf, 'b-', lw=2.5, label=r'Kroupa ($\alpha_1$=1.3, $\alpha_2$=2.3)')

# Mark the break mass
break_mass = 0.5
break_idx = np.argmin(np.abs(mass_grid - break_mass))
ax.axvline(break_mass, color='gray', ls='--', lw=1, alpha=0.7, label=f'Break mass = {break_mass} M☉')

ax.set_xlabel('Mass (M☉)', fontsize=12)
ax.set_ylabel('Normalized probability density', fontsize=12)
ax.set_title('Kroupa IMF (brutus default)', fontsize=14, fontweight='bold')
ax.set_xscale('log')
ax.set_yscale('log')
ax.set_xlim(0.08, 100)
ax.legend(fontsize=11)
ax.grid(True, alpha=0.3)

save_figure(fig, 'imf_kroupa')
plt.show()
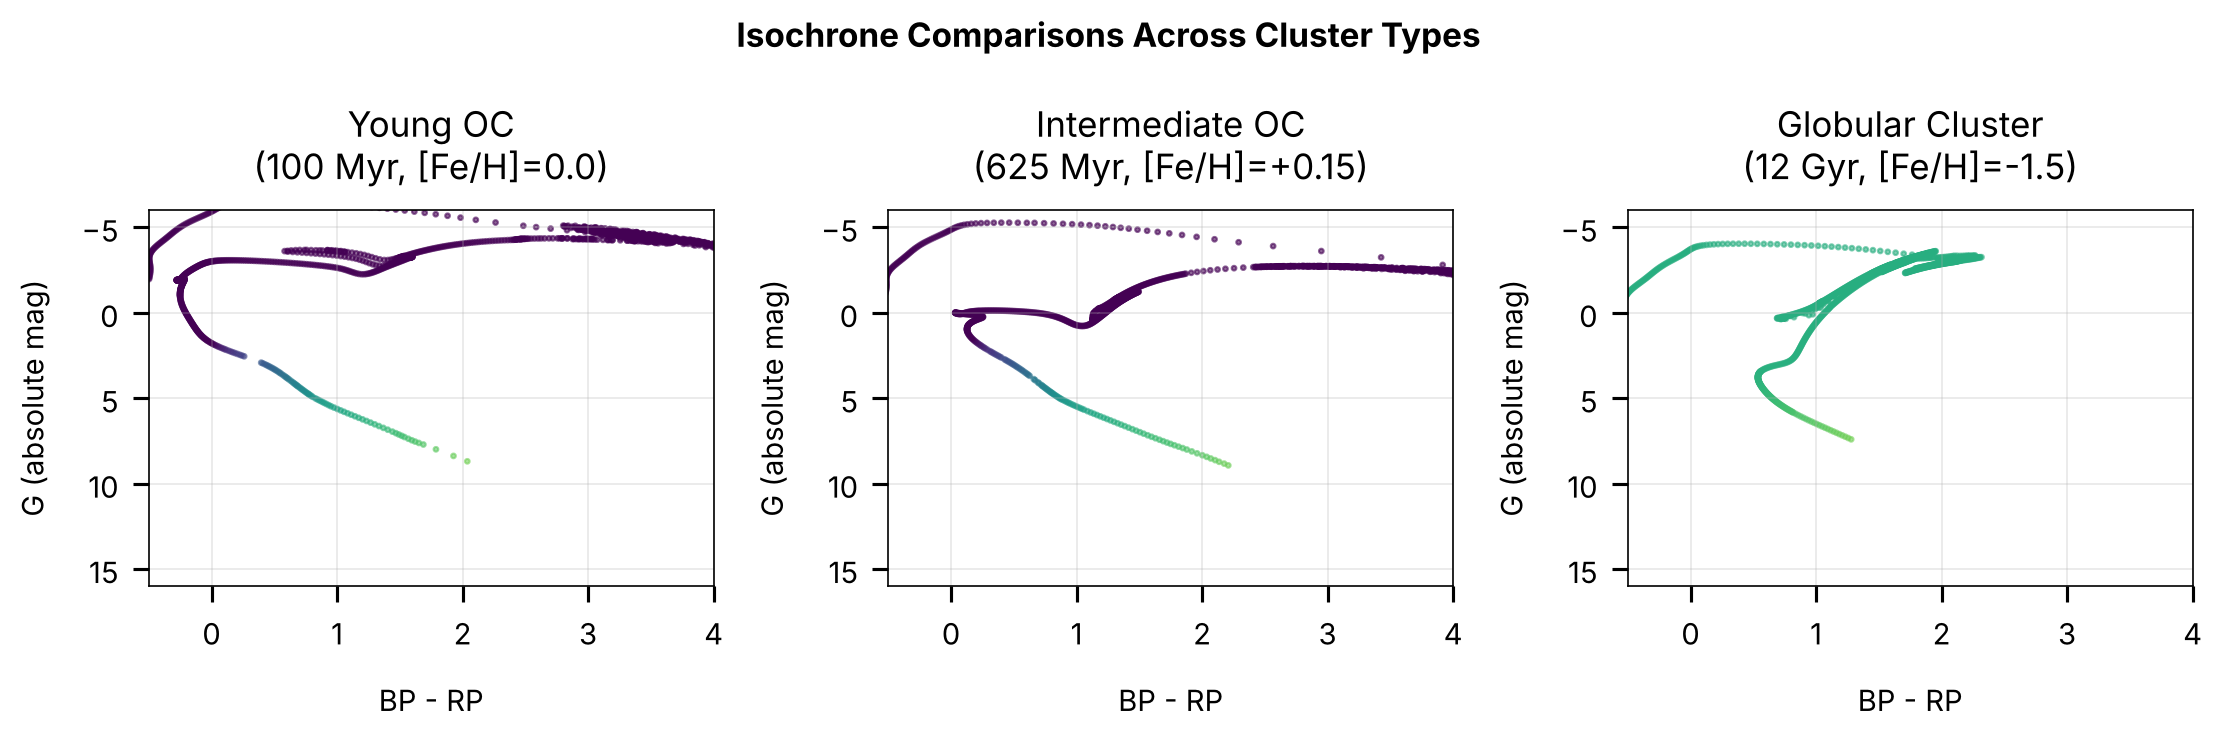
Section 6: Isochrone Comparisons Across Cluster Types
Comparing a young solar-metallicity open cluster (\(100\,{\rm Myr}\), \({\rm [Fe/H]} = 0.0\)), an intermediate-age metal-rich open cluster (\(625\,{\rm Myr}\), \({\rm [Fe/H]} = +0.15\)), and an old metal-poor globular cluster (\(12\,{\rm Gyr}\), \({\rm [Fe/H]} = -1.5\)) illustrates how age and metallicity jointly shape the color-magnitude diagram.
# Extended filter set for multi-wavelength comparison
filt_full = filters.gaia + filters.ps[:3] + filters.tmass
pop_full = StellarPop(isochrone=iso, filters=filt_full, nnfile=nnfile, verbose=False)

# Cluster 1: Young open cluster (Pleiades-like, 100 Myr, [Fe/H]=0.0)
mags1, params1, _ = pop_full.get_seds(
    feh=0.0, afe=0.0, loga=8.0, av=0.0, rv=3.32, dist=10.0, binary_fraction=0.0
)
valid1 = np.all(np.isfinite(mags1), axis=1)

# Cluster 2: Intermediate age (Hyades-like, 625 Myr, [Fe/H]=+0.15)
mags2, params2, _ = pop_full.get_seds(
    feh=0.15, afe=0.0, loga=8.8, av=0.0, rv=3.32, dist=10.0, binary_fraction=0.0
)
valid2 = np.all(np.isfinite(mags2), axis=1)

# Cluster 3: Old globular cluster (12 Gyr, [Fe/H]=-1.5; afe=0.0 in shipped MIST file)
mags3, params3, _ = pop_full.get_seds(
    feh=-1.5, afe=0.0, loga=10.08, av=0.0, rv=3.32, dist=10.0, binary_fraction=0.0
)
valid3 = np.all(np.isfinite(mags3), axis=1)

print(f"Valid EEP points — Young: {valid1.sum()}, Intermediate: {valid2.sum()}, Old GC: {valid3.sum()}")
Valid EEP points — Young: 1315, Intermediate: 1273, Old GC: 1199
# Create isochrone comparison visualization
fig, axes = plt.subplots(1, 3, figsize=(15, 5))

# Top row: Individual isochrone CMDs colored by mass
isochrones = [
    (mags1, params1, valid1, 'Young OC\n(100 Myr, [Fe/H]=0.0)'),
    (mags2, params2, valid2, 'Intermediate OC\n(625 Myr, [Fe/H]=+0.15)'),
    (mags3, params3, valid3, 'Globular Cluster\n(12 Gyr, [Fe/H]=-1.5)'),
]

# Common axis limits for fair comparison
common_xlim = (-0.5, 4.0)
common_ylim = (16, -6)

for idx, (mags, params, valid, title) in enumerate(isochrones):
    ax = axes[idx]

    bp_rp = mags[valid, 1] - mags[valid, 2]
    g_mag = mags[valid, 0]

    if np.any(valid):
        scatter = ax.scatter(bp_rp, g_mag,
                           c=params['mini'][valid],
                           s=5, cmap='viridis_r', vmin=0.1, vmax=2.0, alpha=0.6)
    else:
        ax.text(0.5, 0.5, 'No valid\nphotometry', transform=ax.transAxes,
                ha='center', va='center', fontsize=12, color='gray')

    ax.set_xlabel('BP - RP')
    ax.set_ylabel('G (absolute mag)')
    ax.set_title(title)
    ax.set_xlim(common_xlim)
    ax.set_ylim(common_ylim)
    ax.grid(True, alpha=0.3)

plt.suptitle('Isochrone Comparisons Across Cluster Types', fontsize=16, fontweight='bold')
plt.tight_layout()
save_figure(fig, 'cluster_isochrones')
plt.show()
Summary and Key Takeaways
This tutorial has covered stellar population modeling in brutus:
Key Classes
Isochrone: Models coeval stellar populations
Interpolates MIST isochrone tables
Returns stellar parameters for populations of given age/metallicity
Covers full range of stellar masses at each age
StellarPop: Generates synthetic populations with photometry
Combines Isochrone with neural network photometry
Handles binary populations
Applies extinction and distance effects
Enables realistic cluster simulations
Physical Effects
Age: Determines turnoff mass and RGB properties
Metallicity: Affects colors, luminosities, and evolution
IMF: Controls the mass distribution and low-mass star counts
Binaries: Create broader sequences and affect cluster dynamics
Applications
Star cluster analysis and fitting
Stellar population synthesis
Galactic archaeology studies
Calibration of stellar parameters
Next Steps
Tutorial 3: Model Grids and Performance Optimization
Tutorial 4: Galactic Priors and Population Synthesis
Tutorial 5: Fitting Individual Sources with BruteForce
Tutorial 6: Cluster Analysis and Bayesian Inference