Tutorial 8: Photometric Calibration
Photometric offsets are multiplicative flux corrections that account for systematic differences between observed fluxes and stellar model predictions arising from filter profile mismatches, zero-point calibration systematics, and stellar atmosphere approximations.
Topics Covered
Model grids and SED generation. Evaluating magnitude polynomial coefficients with
get_seds().Synthetic observations. Generating test photometry with known multiplicative offsets.
PhotometricOffsetsConfig. Configuring bootstrap resampling and band-count thresholds.photometric_offsets(). Recovering per-band flux corrections from posterior samples.
Prerequisites
The setup cell below checks the required data files; see Tutorial 00 for download instructions.
# Imports and setup
import numpy as np
import matplotlib.pyplot as plt
import warnings
warnings.filterwarnings('ignore')

# Tutorial utilities
from tutorial_utils import (
    setup_tutorial,
    print_saved_files,
    find_brutus_data_file,
    save_figure as _save_fig,
    print_section,
)

# brutus imports
from brutus.data import load_models
from brutus.core import get_seds
from brutus.analysis import photometric_offsets, PhotometricOffsetsConfig

info = setup_tutorial(8, title="Tutorial 08: Photometric Calibration")
plt.rcParams['figure.figsize'] = (12, 5)


def save_figure(fig, name):
    """Save figure to this tutorial's plot directory."""
    _save_fig(fig, 8, name)
Section 1: Model Grid and SED Computation
The photometric_offsets() function operates on the same model grid used by
BruteForce. Each model is stored as magnitude polynomial coefficients with
shape (n_filters, 3):
Index |
Quantity |
Description |
|---|---|---|
0 |
mag_0 |
Unreddened apparent magnitude (at reference distance) |
1 |
R_0 |
Reddening coefficient at R(V) = 0 |
2 |
dR/dR_V |
Change in reddening coefficient with R(V) |
The reddened magnitude in a given band is:
m(band) = mag_0(band) + A_V * [R_0(band) + R_V * dR(band)]
The get_seds() function applies this formula and optionally converts
magnitudes to linear flux densities. Combined with distance scaling
(F proportional to d^-2), this produces the model photometry that
photometric_offsets() compares against observations.
# Load the stellar model grid with PS1 + 2MASS filters
grid_file = find_brutus_data_file('grid_mist_v9.h5')

filter_names = ['PS_g', 'PS_r', 'PS_i', 'PS_z', 'PS_y',
                '2MASS_J', '2MASS_H', '2MASS_Ks']
short_names = ['g', 'r', 'i', 'z', 'y', 'J', 'H', 'Ks']

models, labels, label_mask = load_models(grid_file, filters=filter_names, verbose=False)
n_models, n_filt, n_coeff = models.shape
print(f"Loaded {n_models:,} models x {n_filt} filters x {n_coeff} coefficients")

# Demonstrate SED generation for a single model
example_idx = n_models // 2
seds_mag = get_seds(models[example_idx:example_idx+1],
                    av=np.array([0.5]), rv=np.array([3.3]),
                    return_flux=False)
seds_flux = get_seds(models[example_idx:example_idx+1],
                     av=np.array([0.5]), rv=np.array([3.3]),
                     return_flux=True)

print(f"Example SED (model {example_idx}, A_V=0.5, R_V=3.3):")
for i in range(n_filt):
    print(f"  {short_names[i]:>2s}: mag = {seds_mag[0, i]:.3f},  flux = {seds_flux[0, i]:.4e}")
Loaded 613,530 models x 8 filters x 3 coefficients
Example SED (model 306765, A_V=0.5, R_V=3.3):
   g: mag = 8.616,  flux = 3.5792e-04
   r: mag = 7.445,  flux = 1.0517e-03
   i: mag = 6.888,  flux = 1.7567e-03
   z: mag = 6.601,  flux = 2.2896e-03
   y: mag = 6.441,  flux = 2.6512e-03
   J: mag = 5.210,  flux = 8.2414e-03
   H: mag = 4.368,  flux = 1.7902e-02
  Ks: mag = 4.224,  flux = 2.0436e-02
Section 2: Generating Synthetic Observations with Known Offsets
To demonstrate offset recovery, we create a controlled experiment:
Select random stellar models from the grid with realistic parameters
Compute true photometry using
get_seds()with distance scalingApply known multiplicative offsets to simulate calibration systematics
Add photometric noise to simulate realistic observations
The photometric_offsets() function returns multiplicative correction
factors (model / observed), so if we apply an offset of 1.05 to the data
(making it 5% brighter), the recovered correction should be 1/1.05 = 0.952
to bring it back to the model prediction.
# Generate synthetic observations with known offsets
rng = np.random.default_rng(42)
n_obj = 200

# Select random models and physical parameters
true_idxs = rng.integers(0, n_models, n_obj)
true_av = rng.uniform(0.0, 1.5, n_obj)
true_rv = rng.uniform(2.8, 3.8, n_obj)
true_dist = rng.uniform(0.5, 5.0, n_obj)  # kpc

# Generate true photometry using get_seds()
true_flux = get_seds(models[true_idxs], av=true_av, rv=true_rv,
                     return_flux=True)
true_flux /= true_dist[:, None]**2  # Scale by distance

# Define known multiplicative offsets per filter
# Values > 1: observed brighter than model; < 1: observed fainter
applied_offsets = np.array([1.04, 0.97, 1.01, 0.98, 1.03, 0.99, 1.02, 0.96])

# Expected corrections: photometric_offsets returns model/observed
expected_corrections = 1.0 / applied_offsets

# Apply offsets and add noise
observed_flux = true_flux * applied_offsets[None, :]
flux_err = 0.03 * np.abs(observed_flux)  # 3% photometric errors
observed_flux = observed_flux + rng.normal(0, flux_err)
observed_flux = np.maximum(observed_flux, 1e-10)  # Ensure positive

# Observation mask: all bands observed
mask = np.ones((n_obj, n_filt), dtype=int)

print(f"Generated {n_obj} synthetic stars across {n_filt} filters")
print(f"Photometric noise: ~3% per band")
print(f"\nApplied multiplicative offsets:")
for i in range(n_filt):
    sign = "+" if applied_offsets[i] > 1 else ""
    pct = (applied_offsets[i] - 1) * 100
    print(f"  {short_names[i]:>2s}: {applied_offsets[i]:.3f}  ({sign}{pct:.1f}%)")
Generated 200 synthetic stars across 8 filters (3% photometric noise)
Applied multiplicative offsets:
   g: 1.040 (+4.0%)    r: 0.970 (-3.0%)    i: 1.010 (+1.0%)    z: 0.980 (-2.0%)
   y: 1.030 (+3.0%)    J: 0.990 (-1.0%)    H: 1.020 (+2.0%)   Ks: 0.960 (-4.0%)
Section 3: Computing Photometric Offsets
The photometric_offsets() function takes posterior samples of model indices,
extinction \(A_V\), reddening shape \(R_V\), and distance for each star. In
practice these come from BruteForce.fit() output. Below, we construct
synthetic posteriors by perturbing the true parameters with Gaussian scatter.
PhotometricOffsetsConfig
The PhotometricOffsetsConfig class controls the offset computation:
Parameter |
Default |
Description |
|---|---|---|
|
300 |
Bootstrap realizations for uncertainty |
|
4 |
Minimum other observed bands (excluding the band being calibrated) for objects where the band was used in fitting |
|
3 |
Minimum observed bands for objects where the band was not used in fitting |
|
|
|
For reproducible results, pass a seeded rng to photometric_offsets().
Likelihood Reweighting
When a band is included in the BruteForce fit, its posterior samples are
pulled toward models that match that band. Setting mask_fit[i] = True
applies leave-one-out reweighting by dividing out band \(i\)’s single-band
likelihood (\(\ln w = \chi^2_i / 2\)), preventing the band from calibrating
itself. Our synthetic posteriors are drawn independently of the observed
fluxes, so we set mask_fit to False below.
# Create synthetic posterior samples and compute offsets
# --- Step 1: Create synthetic posterior samples ---
# In practice, these come from BruteForce.fit() output arrays:
#   model_idx  -> idxs    (n_obj, n_samples)
#   samps_red  -> reds    (n_obj, n_samples)
#   samps_dred -> dreds   (n_obj, n_samples)
#   samps_dist -> dists   (n_obj, n_samples)

n_samp = 25  # posterior samples per star

# Perturb true parameters to simulate posterior uncertainty
idxs = np.tile(true_idxs[:, None], (1, n_samp))
reds = np.clip(rng.normal(true_av[:, None], 0.05, (n_obj, n_samp)), 0.0, 5.0)
dreds = np.clip(rng.normal(true_rv[:, None], 0.05, (n_obj, n_samp)), 2.0, 5.0)
dists = np.clip(rng.normal(true_dist[:, None], 0.1, (n_obj, n_samp)), 0.1, 20.0)

print(f"Posterior samples: {n_obj} objects x {n_samp} samples")
print(f"  A_V perturbation:  sigma ~ 0.05 mag")
print(f"  R_V perturbation:  sigma ~ 0.05")
print(f"  Dist perturbation: sigma ~ 0.1 kpc")

# --- Step 2: Configure offset computation ---
config = PhotometricOffsetsConfig(
    n_bootstrap=300,
    min_bands_used=3,
    min_bands_unused=2,
    uncertainty_method='bootstrap_iqr',
)

# --- Step 3: Run photometric_offsets ---
# mask_fit=False for all bands: uniform weights (no reweighting needed
# since synthetic posteriors are unbiased by construction)
offsets, errors, n_used = photometric_offsets(
    observed_flux, flux_err, mask,
    models, idxs, reds, dreds, dists,
    mask_fit=np.zeros(n_filt, dtype=bool),
    config=config,
    rng=np.random.default_rng(42),
    verbose=False,
)

# --- Step 4: Report results ---
print(f"\n{'Band':>6}  {'Applied':>8}  {'Expected':>9}  {'Recovered':>10}  "
      f"{'Error':>7}  {'N_used':>7}")
print("  " + "-" * 56)
for i in range(n_filt):
    print(f"  {short_names[i]:>4s}  {applied_offsets[i]:>8.4f}  "
          f"{expected_corrections[i]:>9.4f}  {offsets[i]:>10.4f}  "
          f"{errors[i]:>7.4f}  {n_used[i]:>7d}")

residuals = offsets - expected_corrections
rms = np.sqrt(np.mean(residuals**2))
max_err = np.max(np.abs(residuals))
print(f"\nRecovery statistics:")
print(f"  RMS residual:     {rms:.4f} ({rms*100:.2f}%)")
print(f"  Max |residual|:   {max_err:.4f} ({max_err*100:.2f}%)")
print(f"  Mean uncertainty: {np.mean(errors):.4f} ({np.mean(errors)*100:.2f}%)")
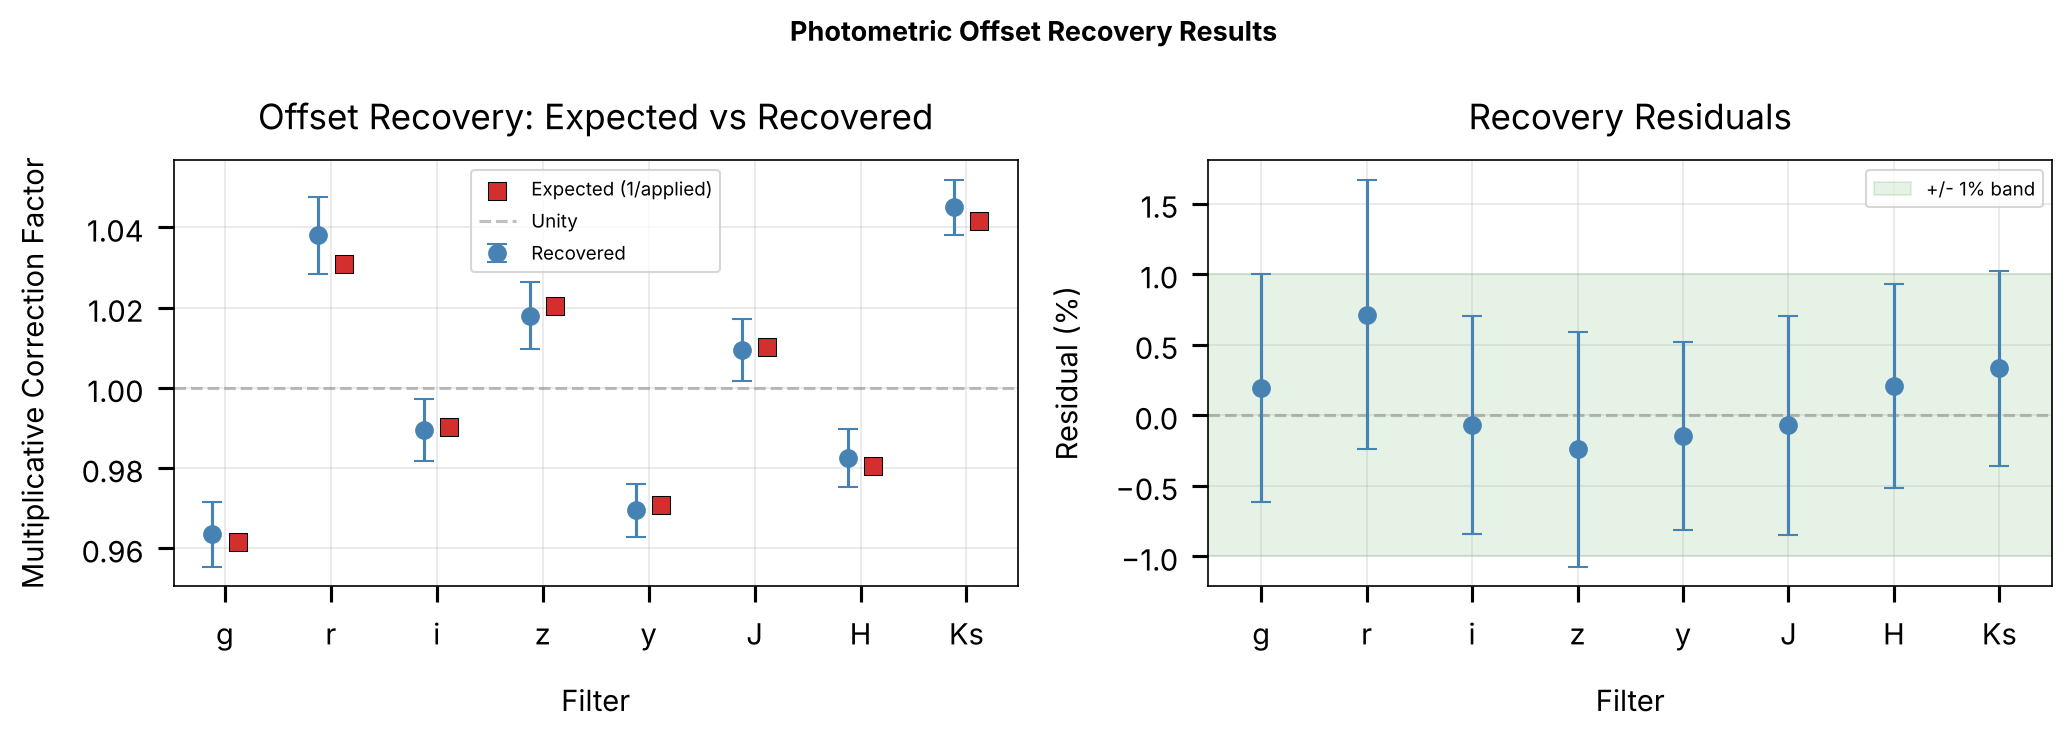
  Band   Applied   Expected   Recovered    Error   N_used
  --------------------------------------------------------
     g    1.0400     0.9615      0.9635   0.0081      200
     r    0.9700     1.0309      1.0381   0.0096      200
     i    1.0100     0.9901      0.9894   0.0077      200
     z    0.9800     1.0204      1.0180   0.0083      200
     y    1.0300     0.9709      0.9694   0.0067      200
     J    0.9900     1.0101      1.0094   0.0078      200
     H    1.0200     0.9804      0.9825   0.0072      200
    Ks    0.9600     1.0417      1.0450   0.0069      200

Recovery statistics:
  RMS residual:     0.0031 (0.31%)
  Max |residual|:   0.0071 (0.71%)
  Mean uncertainty: 0.0078 (0.78%)
# Visualize offset recovery
fig, axes = plt.subplots(1, 2, figsize=(14, 5))

x = np.arange(n_filt)

# Left: recovered vs expected
ax = axes[0]
ax.errorbar(x - 0.12, offsets, yerr=errors, fmt='o', capsize=5,
            color='steelblue', markersize=8, label='Recovered', zorder=5)
ax.scatter(x + 0.12, expected_corrections, marker='s', s=80,
           color='#d32f2f', edgecolor='k', linewidth=0.5,
           label='Expected (1/applied)', zorder=5)
ax.axhline(1.0, color='gray', linestyle='--', alpha=0.5, label='Unity')
ax.set_xlabel('Filter')
ax.set_ylabel('Multiplicative Correction Factor')
ax.set_title('Offset Recovery: Expected vs Recovered')
ax.set_xticks(x)
ax.set_xticklabels(short_names)
ax.legend(fontsize=9)
ax.grid(True, alpha=0.3)

# Right: residuals
ax = axes[1]
ax.errorbar(x, residuals * 100, yerr=errors * 100, fmt='o', capsize=5,
            color='steelblue', markersize=8, zorder=5)
ax.axhline(0.0, color='gray', linestyle='--', alpha=0.5)
ax.fill_between([-0.5, n_filt - 0.5], -1, 1, alpha=0.1, color='green',
                label='+/- 1% band')
ax.set_xlabel('Filter')
ax.set_ylabel('Residual (%)')
ax.set_title('Recovery Residuals')
ax.set_xticks(x)
ax.set_xticklabels(short_names)
ax.set_xlim(-0.5, n_filt - 0.5)
ax.legend(fontsize=9)
ax.grid(True, alpha=0.3)

plt.suptitle('Photometric Offset Recovery Results', fontsize=13,
             fontweight='bold')
plt.tight_layout()
save_figure(fig, 'offset_recovery')
plt.show()
Summary
Key Concepts
Multiplicative convention.
corrected_flux = observed_flux * offset.Model SED evaluation.
get_seds()applies extinction polynomials and converts magnitudes to linear flux.Posterior inputs. Offset estimation marginalizes over
(idxs, reds, dreds, dists)draws from fitting.Bootstrap uncertainty. Uncertainties are estimated across objects via bootstrap resampling (
bootstrap_iqrorbootstrap_std).
The photometric_offsets() Algorithm
Evaluate model SEDs for all posterior samples via
get_seds().Scale model fluxes by inverse distance squared (\(F_{\text{model}} \propto d^{-2}\)).
Compute per-sample flux ratios (\(F_{\text{model}} / F_{\text{obs}}\)) in each band.
Reweight fitted bands by the leave-one-out likelihood (\(\ln w = \chi^2_i / 2\)).
Bootstrap the per-star median ratios to estimate the offset and uncertainty per filter.
Practical Usage
# After BruteForce fitting
offsets, errors, n_used = photometric_offsets(
    phot, err, mask,                      # observed data
    models, idxs, reds, dreds, dists,     # models + fit results
    mask_fit=mask_fit,                    # which bands were fitted
    config=PhotometricOffsetsConfig(),    # configuration
)
phot_corrected = phot * offsets[None, :]  # apply corrections
Next Steps
Tutorial 9: Utility functions for photometry conversions and likelihoods
Tutorial 10: Plotting functions for visualizing fitting results
Tutorial 11: Working with BruteForce output files