Tutorial 9: Utility Functions
The functions in brutus.utils handle photometric unit conversions,
log-likelihood evaluation, linear algebra on \(3 \times 3\) covariance matrices,
and weighted posterior sampling.
Topics Covered
Photometry conversions. Magnitudes, luptitudes, and flux arithmetic.
Photometric likelihoods. Gaussian inlier and chi-square / uniform outlier models.
Mathematical utilities. \(3 \times 3\) matrix inversion, positive semi-definiteness checks, and probability densities.
Sampling utilities. Weighted quantiles, batched multivariate normal draws, and
(scale, A_V, R_V)posterior sampling.
Prerequisites
All examples in this notebook use synthetic data.
# Setup: imports and plot style
import warnings

import numpy as np
import matplotlib.pyplot as plt

warnings.filterwarnings("ignore")

# Tutorial utilities
from tutorial_utils import (
    setup_tutorial,
    save_figure,
    print_section,
    assert_array_properties,
)

# Run the standardized tutorial bootstrap
info = setup_tutorial(9, title="Tutorial 09: Utility Functions")

# Matplotlib defaults for this notebook
plt.rcParams["figure.figsize"] = (10, 6)
1. Photometry Conversions
brutus works internally with linear flux densities rather than magnitudes.
The brutus.utils module provides functions for converting between the two
representations, as well as support for asinh magnitudes (“luptitudes”) that
behave better at faint flux levels.
Key functions
Function |
Description |
|---|---|
|
Flux to magnitude (survey’s native system) |
|
Magnitude (survey’s native system) to flux |
|
Flux to asinh magnitude (Lupton et al. 1999) |
|
Asinh magnitude to flux |
|
Combine fluxes in magnitude space |
Units. |
|
survey units (maggies, \(f = 10^{-0.4m}\) where \(m\) is the apparent magnitude |
|
in the survey’s native system). The functions above transform magnitudes and |
|
uncertainties to and from this linear flux representation. |
from brutus.utils import magnitude, inv_magnitude


# Create synthetic magnitude data: 5 objects, 4 filters
np.random.seed(42)
mag_orig = np.random.uniform(14, 22, size=(5, 4))
mag_err_orig = np.random.uniform(0.01, 0.1, size=(5, 4))

print("Original magnitudes (first object):")
print(f"  mag     = {mag_orig[0]}")
print(f"  mag_err = {mag_err_orig[0]}")

# Convert mag -> flux -> mag
flux, flux_err = inv_magnitude(mag_orig, mag_err_orig)
mag_recovered, mag_err_recovered = magnitude(flux, flux_err)

print("\nRecovered magnitudes (first object):")
print(f"  mag     = {mag_recovered[0]}")
print(f"  mag_err = {mag_err_recovered[0]}")

# Verify round-trip
mag_residual = np.max(np.abs(mag_orig - mag_recovered))
err_residual = np.max(np.abs(mag_err_orig - mag_err_recovered))
print(f"\nMax magnitude residual : {mag_residual:.2e}")
print(f"Max error residual    : {err_residual:.2e}")

assert np.allclose(mag_orig, mag_recovered, atol=1e-12), "Magnitude round-trip failed"
assert np.allclose(mag_err_orig, mag_err_recovered, atol=1e-12), "Error round-trip failed"
print("\nRound-trip verified: mag -> flux -> mag is exact.")
Original magnitudes (first object):
  mag     = [16.99632095 21.60571445 19.85595153 18.78926787]
  mag_err = [0.06506676 0.02255445 0.03629302 0.04297257]
Recovered magnitudes (first object):
  mag     = [16.99632095 21.60571445 19.85595153 18.78926787]
  mag_err = [0.06506676 0.02255445 0.03629302 0.04297257]
Max magnitude residual : 3.55e-15
Max error residual     : 1.39e-17
from brutus.utils import luptitude, inv_luptitude


# Use the same synthetic flux data from above
skynoise = 1e-9  # softening parameter

# flux -> luptitude -> flux
lupt, lupt_err = luptitude(flux, flux_err, skynoise=skynoise)
flux_recovered, flux_err_recovered = inv_luptitude(lupt, lupt_err, skynoise=skynoise)

print("Original flux (first object):")
print(f"  flux     = {flux[0]}")
print(f"\nRecovered flux (first object):")
print(f"  flux     = {flux_recovered[0]}")

flux_residual = np.max(np.abs(flux - flux_recovered))
print(f"\nMax flux residual: {flux_residual:.2e}")

assert np.allclose(flux, flux_recovered, rtol=1e-10), "Luptitude round-trip failed"
print("Round-trip verified: flux -> luptitude -> flux is exact.")

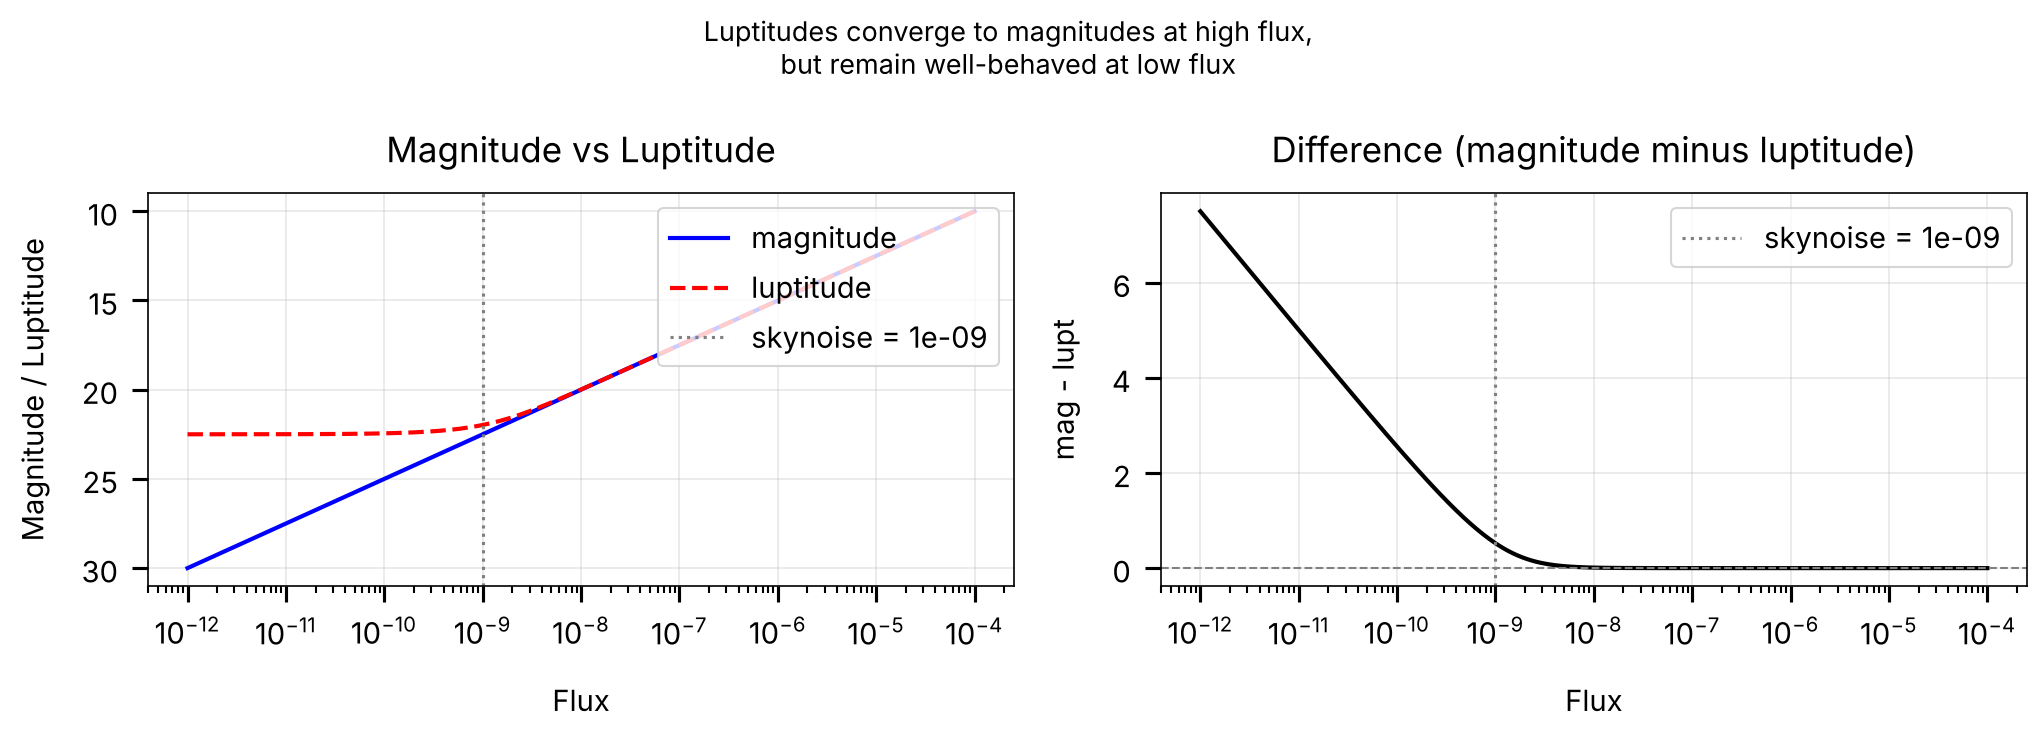
# Compare magnitude vs luptitude for the same data
mag_from_flux, _ = magnitude(flux, flux_err)
print(f"\nMagnitude vs Luptitude (first object):")
print(f"  mag  = {mag_from_flux[0]}")
print(f"  lupt = {lupt[0]}")
print(f"  diff = {mag_from_flux[0] - lupt[0]}")
print("\nFor bright sources the two systems are nearly identical.")
Original flux  (first object): [1.59027276e-07 2.27884202e-09 1.14187716e-08 3.04995092e-08]
Recovered flux (first object): [1.59027276e-07 2.27884202e-09 1.14187716e-08 3.04995092e-08]
Max flux residual: 2.12e-21

Magnitude vs Luptitude (first object):
  mag  = [16.99632095 21.60571445 19.85595153 18.78926787]
  lupt = [16.99627802 21.43966326 19.84771879 18.78810257]
  diff = [4.29294498e-05 1.66051189e-01 8.23274868e-03 1.16530448e-03]
from brutus.utils import add_mag


# Two equal-brightness stars: combined flux should be double,
# which is -2.5 * log10(2) ~ -0.75 mag brighter.
mag1 = np.array([15.0, 18.0, 20.0])
mag2 = np.array([15.0, 18.0, 20.0])

mag_combined = add_mag(mag1, mag2)

expected_shift = -2.5 * np.log10(2)
print(f"Two equal stars (mag = {mag1}):")
print(f"  Combined   = {mag_combined}")
print(f"  Expected   = {mag1 + expected_shift}")
print(f"  Shift      = {expected_shift:.4f} mag (= -2.5 * log10(2))")

assert np.allclose(mag_combined, mag1 + expected_shift, atol=1e-12)

# Unequal stars: 5-mag difference means 100x flux ratio
mag_a = np.array([15.0])
mag_b = np.array([20.0])
print(f"\nBright (mag=15) + faint (mag=20):")
print(f"  Combined = {add_mag(mag_a, mag_b)[0]:.4f} (barely changes the bright star)")
Two equal stars (mag = [15. 18. 20.]):
  Combined = [14.24742501 17.24742501 19.24742501]  (shift = -0.7526 mag = -2.5 * log10(2))
Bright (mag=15) + faint (mag=20):
  Combined = 14.9892
# Demonstrate where luptitudes diverge from magnitudes
flux_range = np.logspace(-12, -4, 500).reshape(1, -1)  # shape (1, N) for API
flux_err_range = 0.1 * flux_range  # 10% errors

skynoise_demo = 1e-9

mag_vals, _ = magnitude(flux_range, flux_err_range)
lupt_vals, _ = luptitude(flux_range, flux_err_range, skynoise=skynoise_demo)

fig, axes = plt.subplots(1, 2, figsize=(14, 5))

# Left: magnitude and luptitude vs flux
ax = axes[0]
ax.plot(flux_range.ravel(), mag_vals.ravel(), "b-", lw=2, label="magnitude")
ax.plot(flux_range.ravel(), lupt_vals.ravel(), "r--", lw=2, label="luptitude")
ax.axvline(skynoise_demo, color="gray", ls=":", lw=1.5, label=f"skynoise = {skynoise_demo:.0e}")
ax.set_xscale("log")
ax.set_xlabel("Flux")
ax.set_ylabel("Magnitude / Luptitude")
ax.set_title("Magnitude vs Luptitude")
ax.legend(loc="upper right")
ax.invert_yaxis()
ax.grid(True, alpha=0.3)

# Right: difference
ax = axes[1]
diff = mag_vals.ravel() - lupt_vals.ravel()
ax.plot(flux_range.ravel(), diff, "k-", lw=2)
ax.axhline(0, color="gray", ls="--", lw=1)
ax.axvline(skynoise_demo, color="gray", ls=":", lw=1.5, label=f"skynoise = {skynoise_demo:.0e}")
ax.set_xscale("log")
ax.set_xlabel("Flux")
ax.set_ylabel("mag - lupt")
ax.set_title("Difference (magnitude minus luptitude)")
ax.legend()
ax.grid(True, alpha=0.3)

plt.suptitle("Luptitudes converge to magnitudes at high flux,\n"
             "but remain well-behaved at low flux", fontsize=13)
save_figure(fig, 9, "mag_vs_luptitude")
plt.show()
2. Photometric Likelihoods
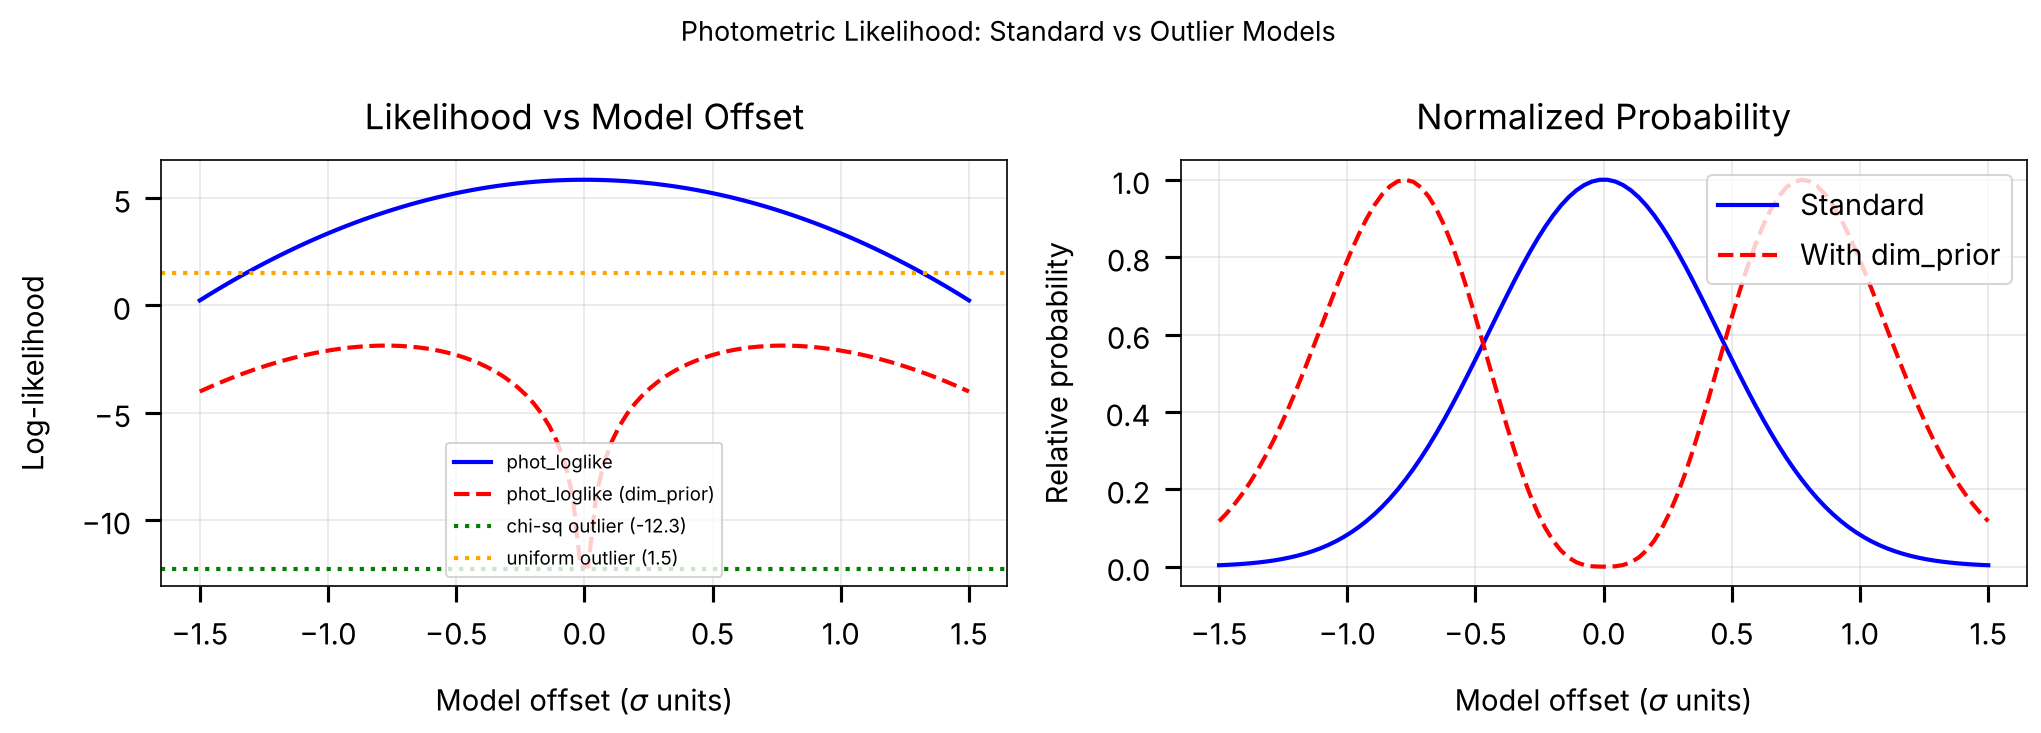
The phot_loglike function computes the Gaussian log-likelihood of observed
photometry given model fluxes, while chisquare_outlier_loglike and
uniform_outlier_loglike evaluate alternative outlier models:
Function |
Description |
|---|---|
|
Standard Gaussian photometric log-likelihood |
|
Chi-square based outlier model (for |
|
Uniform-over-data-range outlier model (for |
uniform_outlier_loglike returns a normalized log-density in linear flux
space (uniform over the observed flux range in each band, padded by
sigma_clip errors), so its value depends on the flux units and data span
and is directly comparable to the Gaussian inlier log-likelihood.
from brutus.utils import phot_loglike
from brutus.utils.photometry import chisquare_outlier_loglike, uniform_outlier_loglike


np.random.seed(123)

# One observed object with 5 filters
Nfilt = 5
true_flux = np.array([[1.0, 2.0, 3.0, 1.5, 0.8]])  # shape (1, 5)
obs_err = np.array([[0.1, 0.15, 0.2, 0.12, 0.08]])  # shape (1, 5)

# Create 100 model fluxes: good match, mediocre, and poor
Nmod = 100
# Models are spread around the truth with varying offsets
offsets = np.linspace(-1.5, 1.5, Nmod)
model_fluxes = true_flux[:, None, :] + offsets[None, :, None] * obs_err[:, None, :]
# shape: (1, 100, 5)

# Compute log-likelihoods
lnl = phot_loglike(true_flux, obs_err, model_fluxes)
lnl_dim = phot_loglike(true_flux, obs_err, model_fluxes, dim_prior=True)

print(f"Observed flux shape   : {true_flux.shape}")
print(f"Model flux shape      : {model_fluxes.shape}")
print(f"Log-likelihood shape  : {lnl.shape}")
print(f"\nBest log-likelihood (no dim_prior) : {lnl.max():.4f}")
print(f"Best log-likelihood (dim_prior)     : {lnl_dim.max():.4f}")

assert_array_properties(lnl, name="lnl", ndim=2, shape=(1, Nmod), finite=True)
print("\nLog-likelihood array properties verified.")
Observed flux shape   : (1, 5)
Model flux shape      : (1, 100, 5)
Log-likelihood shape  : (1, 100)
Best log-likelihood (no dim_prior) : 5.8599
Best log-likelihood (dim_prior)    : -1.8696
# Compute outlier log-likelihoods for the observed object
lnl_chisq_outlier = chisquare_outlier_loglike(true_flux, obs_err)
lnl_uniform_outlier = uniform_outlier_loglike(true_flux, obs_err)

print(f"Chi-square outlier log-likelihood : {lnl_chisq_outlier[0]:.4f}")
print(f"Uniform outlier log-likelihood    : {lnl_uniform_outlier[0]:.4f}")
print(f"Best normal model log-likelihood  : {lnl.max():.4f}")

print("\nInterpretation:")
print("  If the best model lnl exceeds the outlier lnl, the object is well-fit.")
print("  If outlier lnl is higher, the object may be a contaminant or artifact.")

assert_array_properties(lnl_chisq_outlier, name="chisq_outlier", ndim=1, shape=(1,), finite=True)
assert_array_properties(lnl_uniform_outlier, name="uniform_outlier", ndim=1, shape=(1,), finite=True)
print("\nOutlier log-likelihood properties verified.")
Chi-square outlier log-likelihood : -12.3016
Uniform outlier log-likelihood    : 1.4963
Best normal model log-likelihood  : 5.8599
fig, axes = plt.subplots(1, 2, figsize=(14, 5))

# Left: normal vs dim_prior likelihood curves
ax = axes[0]
ax.plot(offsets, lnl.ravel(), "b-", lw=2, label="phot_loglike")
ax.plot(offsets, lnl_dim.ravel(), "r--", lw=2, label="phot_loglike (dim_prior)")
ax.axhline(lnl_chisq_outlier[0], color="green", ls=":", lw=2,
           label=f"chi-sq outlier ({lnl_chisq_outlier[0]:.1f})")
ax.axhline(lnl_uniform_outlier[0], color="orange", ls=":", lw=2,
           label=f"uniform outlier ({lnl_uniform_outlier[0]:.1f})")
ax.set_xlabel(r"Model offset ($\sigma$ units)")
ax.set_ylabel("Log-likelihood")
ax.set_title("Likelihood vs Model Offset")
ax.legend(fontsize=9, loc="lower center")
ax.grid(True, alpha=0.3)

# Right: probability (exp-normalized)
ax = axes[1]
p_normal = np.exp(lnl.ravel() - lnl.max())
p_dim = np.exp(lnl_dim.ravel() - lnl_dim.max())

ax.plot(offsets, p_normal, "b-", lw=2, label="Standard")
ax.plot(offsets, p_dim, "r--", lw=2, label="With dim_prior")
ax.set_xlabel(r"Model offset ($\sigma$ units)")
ax.set_ylabel("Relative probability")
ax.set_title("Normalized Probability")
ax.legend()
ax.grid(True, alpha=0.3)

plt.suptitle("Photometric Likelihood: Standard vs Outlier Models", fontsize=13)
save_figure(fig, 9, "likelihood_comparison")
plt.show()
3. Mathematical Utilities
The brutus.utils math module provides:
Fast 3x3 matrix inversion optimized for covariance matrices (
inverse3)Positive semi-definiteness check (
isPSD)Chi-square log-PDF (
chisquare_logpdf)Truncated normal PDF / log-PDF (
truncnorm_pdf,truncnorm_logpdf)
from brutus.utils import inverse3, isPSD


# Create a random positive-definite 3x3 matrix
np.random.seed(99)
L = np.array([[2.0, 0.0, 0.0],
              [0.5, 1.5, 0.0],
              [0.3, 0.2, 1.0]])
A = L @ L.T  # guaranteed positive-definite

print("Matrix A:")
print(A)

# Invert with brutus
A_inv = inverse3(A)

print("\nInverse A_inv:")
print(A_inv)

# Verify: A @ A_inv should be identity
product = A @ A_inv
print("\nA @ A_inv:")
print(product)

identity_error = np.max(np.abs(product - np.eye(3)))
print(f"\nMax deviation from identity: {identity_error:.2e}")

assert np.allclose(product, np.eye(3), atol=1e-10), "Inversion check failed"
print("Verification passed: A @ A_inv = I.")
Matrix A:
[[4.   1.   0.6 ]
 [1.   2.5  0.45]
 [0.6  0.45 1.13]]

Inverse A_inv:
[[ 0.29138889 -0.09555556 -0.11666667]
 [-0.09555556  0.46222222 -0.13333333]
 [-0.11666667 -0.13333333  1.        ]]

Max deviation from identity (A @ A_inv - I): 8.88e-17
# Test 1: positive-definite matrix (from above)
print(f"A (positive-definite covariance):  isPSD = {isPSD(A)}")

# Test 2: identity matrix
I3 = np.eye(3)
print(f"Identity matrix:                   isPSD = {isPSD(I3)}")

# Test 3: zero matrix (positive semi-definite but not positive-definite)
Z3 = np.zeros((3, 3))
print(f"Zero matrix:                       isPSD = {isPSD(Z3)}")

# Test 4: matrix with a negative eigenvalue (NOT PSD)
bad_matrix = np.array([[1.0, 0.0, 0.0],
                       [0.0, -1.0, 0.0],
                       [0.0, 0.0, 1.0]])
print(f"Matrix with neg eigenvalue:        isPSD = {isPSD(bad_matrix)}")

# Test 5: non-symmetric matrix (NOT PSD by definition)
nonsym = np.array([[1.0, 2.0, 0.0],
                   [0.0, 1.0, 0.0],
                   [0.0, 0.0, 1.0]])
print(f"Non-symmetric matrix:              isPSD = {isPSD(nonsym)}")

assert isPSD(A), "PD matrix should be PSD"
assert not isPSD(bad_matrix), "Matrix with neg eigenvalue should not be PSD"
assert not isPSD(nonsym), "Non-symmetric matrix should not be PSD"
print("\nAll checks passed.")
A (positive-definite covariance):  isPSD = True
Identity matrix:                   isPSD = True
Zero matrix:                       isPSD = True
Matrix with neg eigenvalue:        isPSD = False
Non-symmetric matrix:              isPSD = False
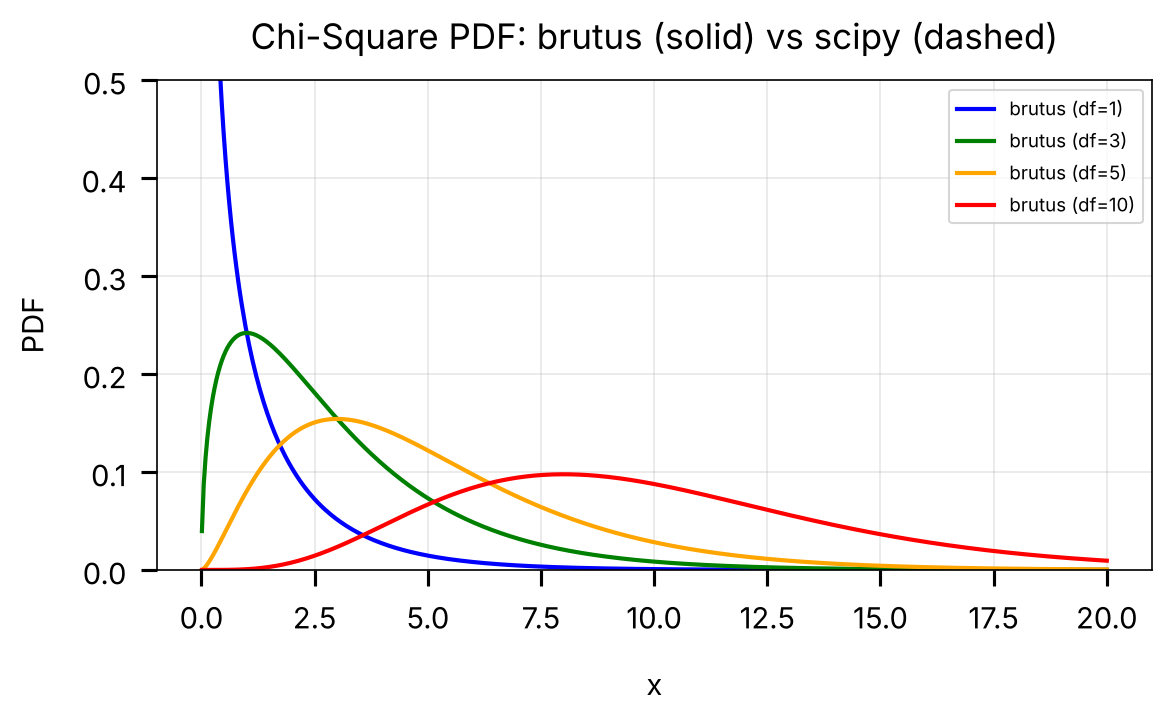
from brutus.utils import chisquare_logpdf
from scipy.stats import chi2 as scipy_chi2


x = np.linspace(0.01, 20, 500)
dofs = [1, 3, 5, 10]

fig, ax = plt.subplots(1, 1, figsize=(8, 5))

colors = ["blue", "green", "orange", "red"]
for df, color in zip(dofs, colors):
    logpdf_brutus = chisquare_logpdf(x, df=df)
    logpdf_scipy = scipy_chi2.logpdf(x, df=df)
    ax.plot(x, np.exp(logpdf_brutus), color=color, lw=2, label=f"brutus (df={df})")
    ax.plot(x, np.exp(logpdf_scipy), color=color, lw=1, ls="--", alpha=0.7)

ax.set_xlabel("x")
ax.set_ylabel("PDF")
ax.set_title("Chi-Square PDF: brutus (solid) vs scipy (dashed)")
ax.legend(fontsize=9)
ax.set_ylim(0, 0.5)
ax.grid(True, alpha=0.3)

save_figure(fig, 9, "chisquare_comparison")
plt.show()

# Numerical verification for df=5
logpdf_b = chisquare_logpdf(x, df=5)
logpdf_s = scipy_chi2.logpdf(x, df=5)
max_diff = np.max(np.abs(logpdf_b - logpdf_s))
print(f"Max |log-PDF difference| for df=5: {max_diff:.2e}")
assert max_diff < 1e-10, f"Chi-square implementations disagree: {max_diff}"
print("brutus and scipy chi-square log-PDFs agree to machine precision.")
Max |log-PDF difference| for df=5: 1.78e-15
from brutus.utils import truncnorm_pdf, truncnorm_logpdf
from scipy.stats import truncnorm as scipy_truncnorm


# Parameters: standard normal truncated to [-2, 3]
a, b = -2.0, 3.0
loc, scale = 0.0, 1.0

x = np.linspace(-4, 5, 500)

# brutus
pdf_brutus = truncnorm_pdf(x, a, b, loc=loc, scale=scale)
logpdf_brutus = truncnorm_logpdf(x, a, b, loc=loc, scale=scale)

# scipy (note: scipy uses standardized a, b limits)
a_std = (scale * a + loc - loc) / scale  # = a
b_std = (scale * b + loc - loc) / scale  # = b
pdf_scipy = scipy_truncnorm.pdf(x, a_std, b_std, loc=loc, scale=scale)
logpdf_scipy = scipy_truncnorm.logpdf(x, a_std, b_std, loc=loc, scale=scale)

fig, axes = plt.subplots(1, 2, figsize=(14, 5))

# Left: PDF comparison
ax = axes[0]
ax.plot(x, pdf_brutus, "b-", lw=2, label="brutus truncnorm_pdf")
ax.plot(x, pdf_scipy, "r--", lw=1.5, alpha=0.7, label="scipy truncnorm.pdf")
ax.axvline(scale * a + loc, color="gray", ls=":", lw=1.5, label=f"bounds [{scale*a+loc}, {scale*b+loc}]")
ax.axvline(scale * b + loc, color="gray", ls=":", lw=1.5)
ax.set_xlabel("x")
ax.set_ylabel("PDF")
ax.set_title("Truncated Normal PDF")
ax.legend(fontsize=9)
ax.grid(True, alpha=0.3)

# Right: log-PDF comparison
ax = axes[1]
ax.plot(x, logpdf_brutus, "b-", lw=2, label="brutus truncnorm_logpdf")
ax.plot(x, logpdf_scipy, "r--", lw=1.5, alpha=0.7, label="scipy truncnorm.logpdf")
ax.axvline(scale * a + loc, color="gray", ls=":", lw=1.5)
ax.axvline(scale * b + loc, color="gray", ls=":", lw=1.5)
ax.set_xlabel("x")
ax.set_ylabel("Log-PDF")
ax.set_title("Truncated Normal Log-PDF")
ax.set_ylim(-20, 2)
ax.legend(fontsize=9)
ax.grid(True, alpha=0.3)

save_figure(fig, 9, "truncnorm_comparison")
plt.show()

# Verify in the interior of the support
interior = (x > scale * a + loc + 0.01) & (x < scale * b + loc - 0.01)
max_pdf_diff = np.max(np.abs(pdf_brutus[interior] - pdf_scipy[interior]))
max_logpdf_diff = np.max(np.abs(logpdf_brutus[interior] - logpdf_scipy[interior]))

print(f"Max |PDF difference| in interior:     {max_pdf_diff:.2e}")
print(f"Max |log-PDF difference| in interior: {max_logpdf_diff:.2e}")
assert max_pdf_diff < 1e-10, f"Truncated normal PDF mismatch: {max_pdf_diff}"
assert max_logpdf_diff < 1e-10, f"Truncated normal log-PDF mismatch: {max_logpdf_diff}"
print("brutus and scipy truncated normal implementations agree.")
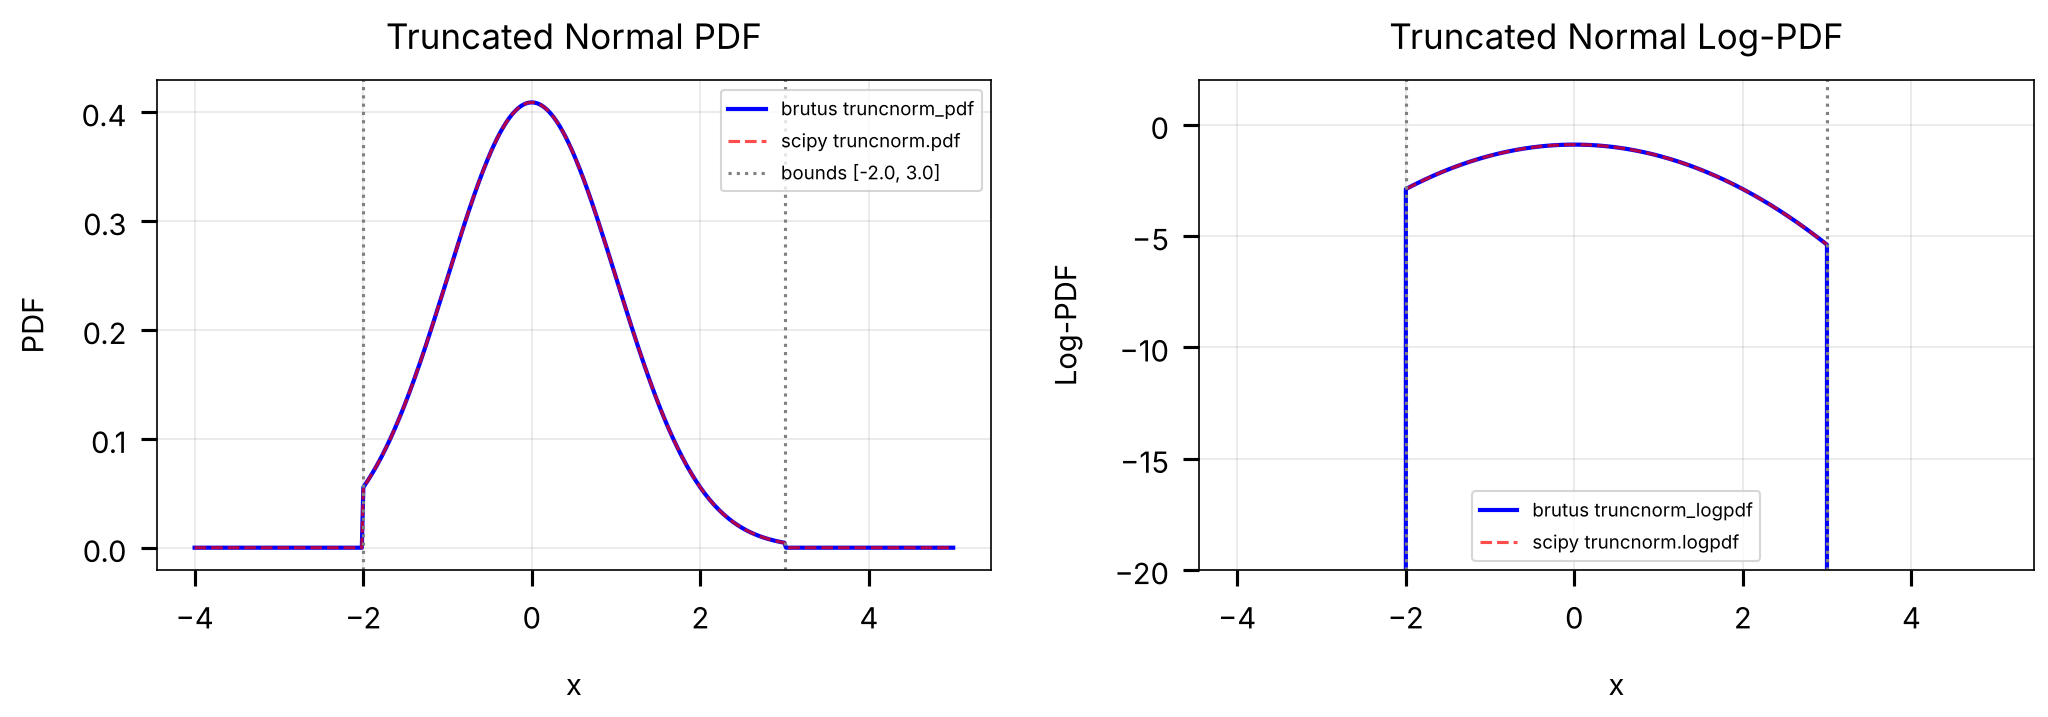
Max |PDF difference| in interior:     0.00e+00
Max |log-PDF difference| in interior: 0.00e+00
4. Sampling Utilities
These functions are used for posterior analysis after fitting:
Function |
Description |
|---|---|
|
Compute (weighted) quantiles from samples |
|
Draw from multiple multivariate normals simultaneously |
|
Draw from joint (scale, A_V, R_V) posterior |
from brutus.utils import quantile


np.random.seed(77)

# Unweighted case
samples = np.sort(np.random.normal(5.0, 1.5, size=10000))
q_values = np.array([0.16, 0.50, 0.84])
q_unw = quantile(samples, q_values)

print("Unweighted samples (N=10000, mean=5, std=1.5):")
print(f"  16th percentile : {q_unw[0]:.3f}  (expected ~{5.0 - 1.5:.1f})")
print(f"  50th percentile : {q_unw[1]:.3f}  (expected ~5.0)")
print(f"  84th percentile : {q_unw[2]:.3f}  (expected ~{5.0 + 1.5:.1f})")

# Weighted case: heavily weight the upper tail
weights = np.where(samples > 6.0, 10.0, 1.0)
q_wt = quantile(samples, q_values, weights=weights)

print("\nWeighted samples (10x weight for samples > 6):")
print(f"  16th percentile : {q_wt[0]:.3f}")
print(f"  50th percentile : {q_wt[1]:.3f}")
print(f"  84th percentile : {q_wt[2]:.3f}")
print(f"\nWeighted median shifted from {q_unw[1]:.3f} to {q_wt[1]:.3f} (toward high values).")

assert_array_properties(q_unw, name="quantiles_unw", ndim=1, shape=(3,), finite=True)
assert_array_properties(q_wt, name="quantiles_wt", ndim=1, shape=(3,), finite=True)
assert q_wt[1] > q_unw[1], "Weighted median should be larger"
print("Quantile computations verified.")
Unweighted samples (N=10000, mean=5, std=1.5):
  [16th, 50th, 84th] percentiles = [3.492, 4.982, 6.506]
Weighted samples (10x weight for samples > 6):
  [16th, 50th, 84th] percentiles = [5.077, 6.482, 7.480]
from brutus.utils import sample_multivariate_normal


np.random.seed(42)

# Define a 2D distribution with correlation
mean = np.array([3.0, -1.0])
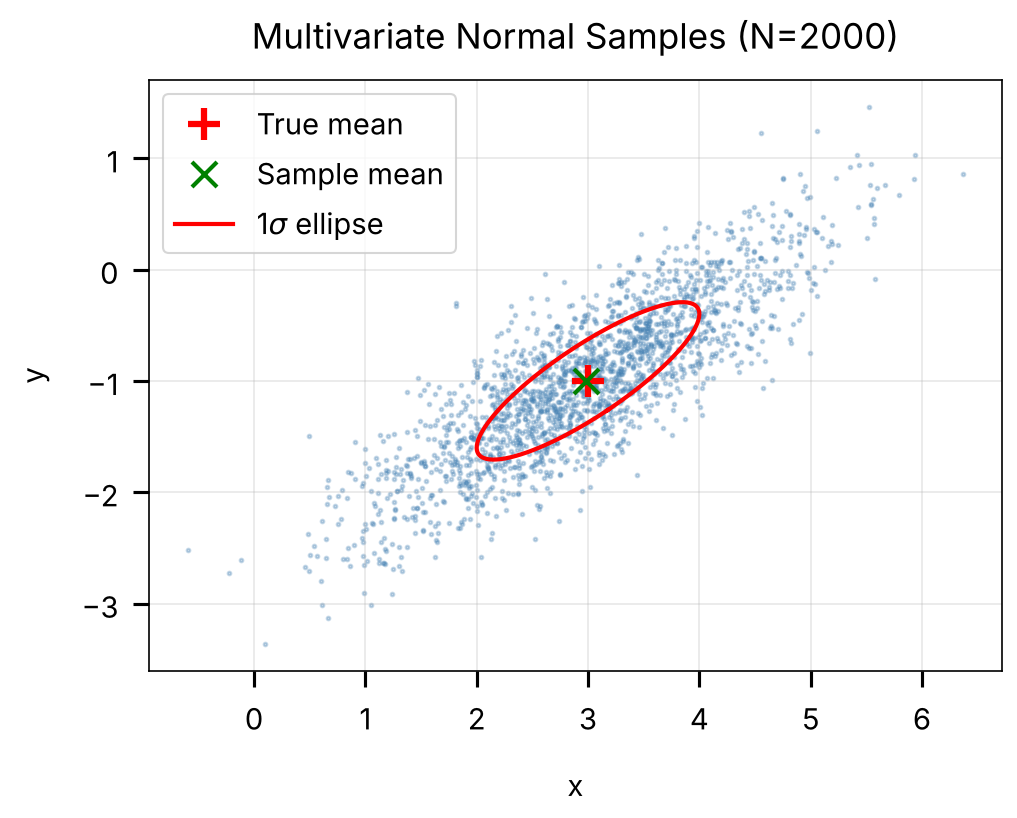
cov = np.array([[1.0, 0.6],
                [0.6, 0.5]])

print(f"Mean: {mean}")
print(f"Covariance:\n{cov}")
print(f"isPSD(cov) = {isPSD(cov)}")

# Draw 2000 samples from a single distribution
Nsamples = 2000
samples_2d = sample_multivariate_normal(mean, cov, size=Nsamples)
print(f"\nSamples shape: {samples_2d.shape}  (dim, size)")

# Verify sample statistics
sample_mean = samples_2d.mean(axis=1)
sample_cov = np.cov(samples_2d)
print(f"\nSample mean: {sample_mean}  (expected: {mean})")
print(f"Sample cov:\n{sample_cov}")
print(f"(expected:\n{cov})")

assert_array_properties(samples_2d, name="mvn_samples", ndim=2, shape=(2, Nsamples), finite=True)

# Plot
fig, ax = plt.subplots(1, 1, figsize=(7, 6))
ax.scatter(samples_2d[0], samples_2d[1], s=3, alpha=0.3, color="steelblue")
ax.plot(mean[0], mean[1], "r+", markersize=15, mew=3, label="True mean")
ax.plot(sample_mean[0], sample_mean[1], "gx", markersize=12, mew=2, label="Sample mean")

# Draw 1-sigma ellipse
theta = np.linspace(0, 2 * np.pi, 200)
eigvals, eigvecs = np.linalg.eigh(cov)
circle = np.column_stack([np.cos(theta), np.sin(theta)])
ellipse = circle @ np.diag(np.sqrt(eigvals)) @ eigvecs.T + mean
ax.plot(ellipse[:, 0], ellipse[:, 1], "r-", lw=2, label=r"1$\sigma$ ellipse")

ax.set_xlabel("x")
ax.set_ylabel("y")
ax.set_title(f"Multivariate Normal Samples (N={Nsamples})")
ax.legend()
ax.set_aspect("equal")
ax.grid(True, alpha=0.3)

save_figure(fig, 9, "mvn_samples")
plt.show()
Samples shape: (2, 2000)
Sample mean: [ 2.984 -1.000]  (true: [ 3.0 -1.0])
4c. Scale Factor, Distance, and Extinction
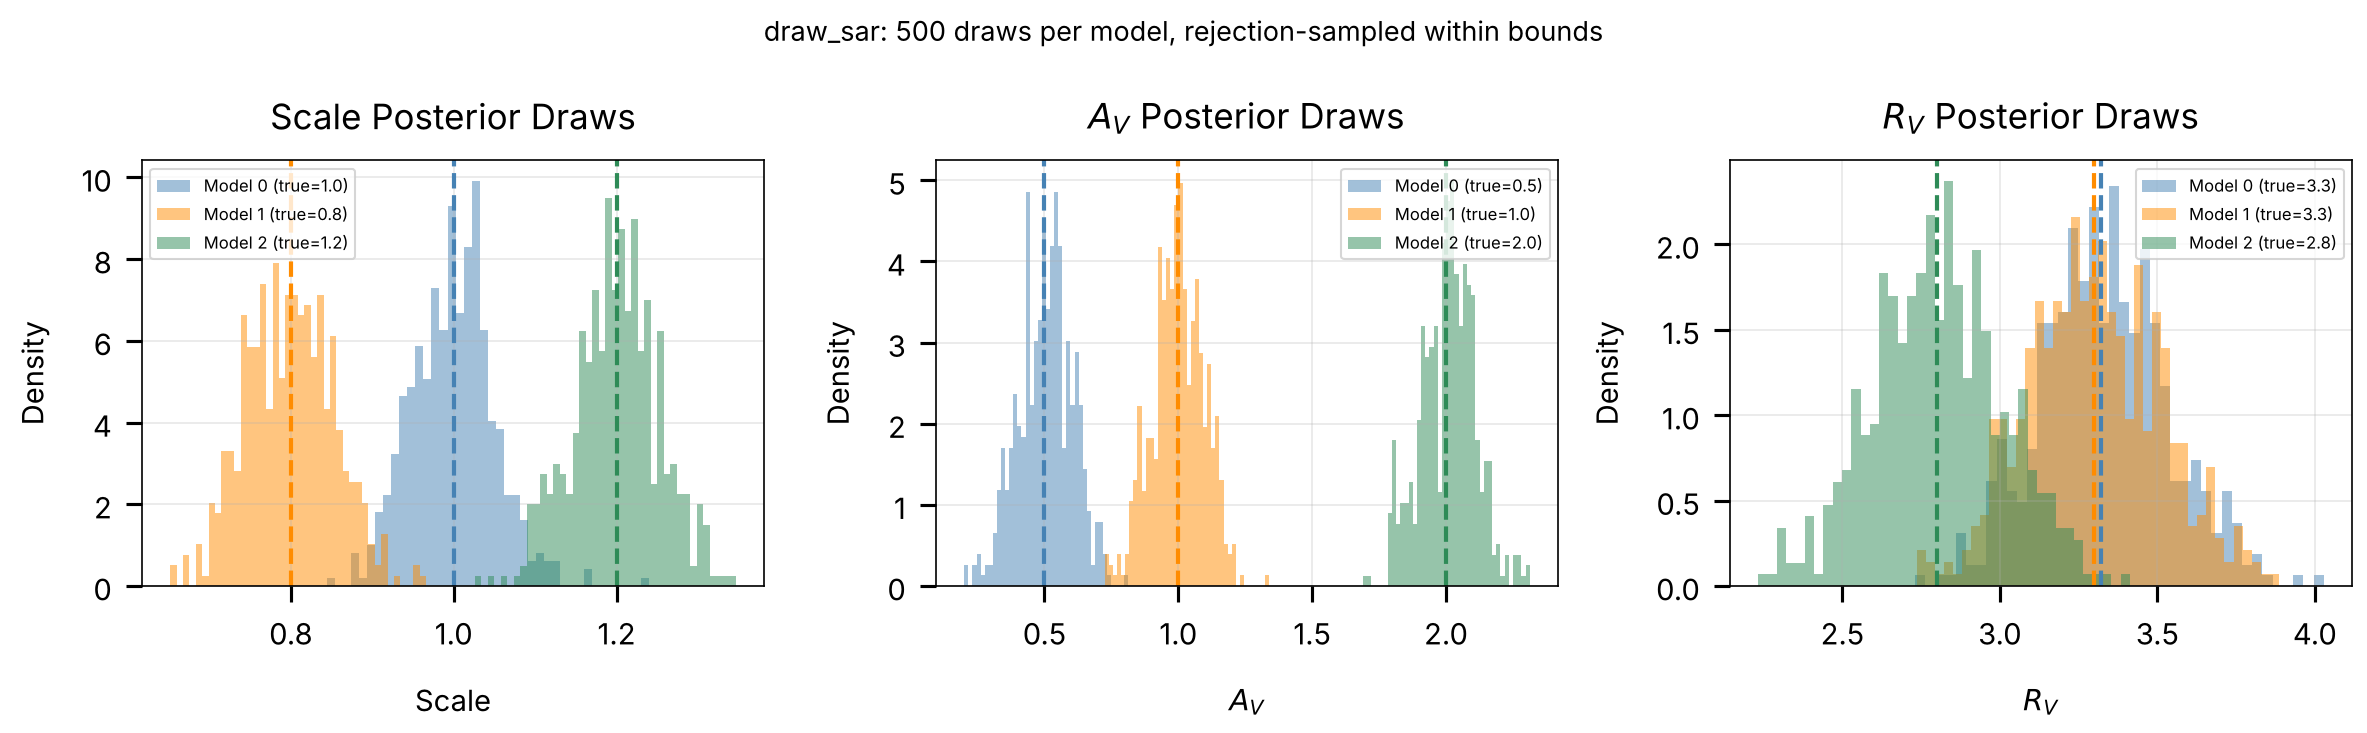
The draw_sar function draws correlated samples of (scale, A_V, R_V)
from the Gaussian approximation at each model grid point:
Scale definition. The scale factor is the squared ratio of the reference distance (\(d_{\text{ref}} = 1\,\text{kpc}\)) to the true distance,
scale = (d_ref / d)^2 = 1 / d_kpc^2.Distance conversion. Convert a scale draw to distance in kpc via
d_kpc = 1 / sqrt(scale). Larger scale values correspond to closer objects.
The main BruteForce fitting pipeline samples in log-distance space
because the posterior in scale space becomes skewed for faint or distant
sources. draw_sar remains useful when generating correlated
(scale, A_V, R_V) realizations from the per-model covariance matrices
stored in BruteForce HDF5 outputs.
In the histograms below, the correlated (scale, A_V, R_V) draws reflect
the trade-off between distance and extinction, where closer inferred
distances (higher scale) require lower foreground extinction (\(A_V\)).
from brutus.utils import draw_sar


np.random.seed(55)

# Simulate posterior parameters for 3 model grid points
Nsamps = 3
scales = np.array([1.0, 0.8, 1.2])     # scale factors
avs = np.array([0.5, 1.0, 2.0])        # A_V values
rvs = np.array([3.32, 3.3, 2.8])        # R_V values

# Covariance matrices (3x3 each)
covs_sar = np.zeros((Nsamps, 3, 3))
for i in range(Nsamps):
    L = np.diag([0.05, 0.1, 0.2])  # diagonal Cholesky factor
    L[1, 0] = 0.02  # small s-Av correlation
    L[2, 0] = 0.01  # small s-Rv correlation
    L[2, 1] = 0.05  # Av-Rv correlation
    covs_sar[i] = L @ L.T

print("Input parameters:")
for i in range(Nsamps):
    print(f"  Model {i}: scale={scales[i]:.2f}, A_V={avs[i]:.2f}, R_V={rvs[i]:.2f}")

# Generate draws
ndraws = 500
sdraws, adraws, rdraws = draw_sar(
    scales, avs, rvs, covs_sar, ndraws=ndraws,
    avlim=(0.0, 6.0), rvlim=(1.0, 8.0)
)

print(f"\nDraw shapes: scale={sdraws.shape}, A_V={adraws.shape}, R_V={rdraws.shape}")

assert_array_properties(sdraws, name="scale_draws", ndim=2, shape=(Nsamps, ndraws), finite=True)
assert_array_properties(adraws, name="av_draws", ndim=2, shape=(Nsamps, ndraws), finite=True,
                        min_val=0.0, max_val=6.0)
assert_array_properties(rdraws, name="rv_draws", ndim=2, shape=(Nsamps, ndraws), finite=True,
                        min_val=1.0, max_val=8.0)
print("All draws within specified bounds (A_V: [0, 6], R_V: [1, 8]).")

# Plot the draws
fig, axes = plt.subplots(1, 3, figsize=(16, 5))

param_names = ["Scale", r"$A_V$", r"$R_V$"]
draw_arrays = [sdraws, adraws, rdraws]
true_vals = [scales, avs, rvs]
colors = ["steelblue", "darkorange", "seagreen"]

for col, (ax, pname, draws, trues) in enumerate(
    zip(axes, param_names, draw_arrays, true_vals)
):
    for i in range(Nsamps):
        ax.hist(draws[i], bins=40, alpha=0.5, density=True,
                color=colors[i], label=f"Model {i} (true={trues[i]:.1f})")
        ax.axvline(trues[i], color=colors[i], ls="--", lw=2)
    ax.set_xlabel(pname)
    ax.set_ylabel("Density")
    ax.set_title(f"{pname} Posterior Draws")
    ax.legend(fontsize=8)
    ax.grid(True, alpha=0.3)

plt.suptitle(f"draw_sar: {ndraws} draws per model, rejection-sampled within bounds",
             fontsize=13)
save_figure(fig, 9, "draw_sar")
plt.show()
Draw shapes: scale=(3, 500), A_V=(3, 500), R_V=(3, 500) (all within bounds)
Summary
Photometry Conversions (Section 1)
magnitudeandinv_magnitudeconvert between linear flux (maggies) and magnitudes in the survey’s native system (with zero points set byzeropoints).luptitudeandinv_luptitudecompute asinh magnitudes that remain finite at zero or negative flux.add_magsums fluxes expressed in magnitudes.
Photometric Likelihoods (Section 2)
phot_loglikeevaluates the Gaussian photometric log-likelihood, withdim_prior=Trueadding a chi-square dimensionality term.chisquare_outlier_loglikeanduniform_outlier_loglikeevaluate baseline outlier log-likelihoods for mixture modeling.
Mathematical Utilities (Section 3)
inverse3computes numba-accelerated \(3 \times 3\) matrix inverses.isPSDchecks whether a matrix is symmetric and positive semi-definite.chisquare_logpdf,truncnorm_pdf, andtruncnorm_logpdfevaluate chi-square and truncated normal densities.
Sampling Utilities (Section 4)
quantilecomputes weighted sample quantiles.sample_multivariate_normaldraws from batched multivariate normal distributions via Cholesky decomposition.draw_sargenerates rejection-sampled posterior draws for(scale, A_V, R_V)within physical bounds.
Next Steps
Tutorial 5:
phot_loglikein theBruteForcefitterTutorial 6:
draw_sarandquantilein cluster analysisTutorial 8: Photometric offsets and magnitude conversions