Tutorial 11: Working with BruteForce Results
brutus.analysis.BruteForce writes posterior samples, maximum-likelihood
scale/extinction estimates, local covariance matrices, and goodness-of-fit
statistics for every fitted object to an HDF5 file.
Topics Covered
Loading results. Inspecting HDF5 datasets, shapes, and data types.
Understanding output arrays. Relating per-sample and per-object datasets to model parameters.
Computing posterior summaries. Extracting medians and credible intervals for distance, \(A_V\), and \(R_V\).
Sampling from posteriors. Drawing correlated
(s, A_V, R_V)realizations withdraw_sar.Photometric conversions. Converting between linear flux densities (maggies) and magnitudes.
Visualization. Plotting posteriors with
dist_vs_redandcornerplot.Quality assessment. Computing \(\chi^2\) survival probabilities (\(p\)-values) and flagging outliers.
Prerequisites
The setup cell below checks the required data files; see Tutorial 00 for download instructions.
# Setup: imports and plot style
import warnings
from pathlib import Path

import numpy as np
import matplotlib.pyplot as plt

warnings.filterwarnings("ignore")

# Tutorial utilities
from tutorial_utils import (
    setup_tutorial,
    save_figure,
    print_section,
    find_brutus_data_file,
    load_example_results,
    assert_array_properties,
)

# Run the standardized tutorial bootstrap
info = setup_tutorial(11, title="Tutorial 11: Working with BruteForce Results")

# Matplotlib defaults for this notebook
plt.rcParams["figure.figsize"] = (10, 6)
Section 1: Loading Results
BruteForce writes its output to an HDF5 file containing several datasets.
The convenience function load_example_results() from tutorial_utils
loads all top-level datasets into a dictionary. We also demonstrate
opening the file directly with h5py to inspect its raw structure.
# ---------------------------------------------------------------
# Load pre-computed BruteForce results
# ---------------------------------------------------------------
DATA_AVAILABLE = False
results = None

try:
    results = load_example_results("Orion_l209.1_b-19.9_mist.h5")
    DATA_AVAILABLE = True
    print("Loaded BruteForce results.")
    print(f"  File: {Path(results['filename']).name}")
except FileNotFoundError as exc:
    print("Results file not found -- sections that need it will be skipped.")
    print(f"  ({exc})")
Loaded BruteForce results.
  File: Orion_l209.1_b-19.9_mist.h5
# ---------------------------------------------------------------
# Inspect the raw HDF5 structure with h5py
# ---------------------------------------------------------------
if DATA_AVAILABLE:
    import h5py

    filepath = results["filename"]
    with h5py.File(filepath, "r") as f:
        print(f"  File: {Path(filepath).name}\n")
        print(f"  {'Key':20s}  {'Shape':20s}  {'Dtype':15s}")
        print(f"  {'-'*20}  {'-'*20}  {'-'*15}")
        for key in sorted(f.keys()):
            if isinstance(f[key], h5py.Dataset):
                ds = f[key]
                print(f"  {key:20s}  {str(ds.shape):20s}  {str(ds.dtype):15s}")
            elif isinstance(f[key], h5py.Group):
                print(f"  {key:20s}  [GROUP]")
                for subkey in f[key].keys():
                    ds = f[key][subkey]
                    if isinstance(ds, h5py.Dataset):
                        print(
                            f"    {key}/{subkey:16s}  "
                            f"{str(ds.shape):20s}  {str(ds.dtype):15s}"
                        )
  File: Orion_l209.1_b-19.9_mist.h5

  Key                   Shape                 Dtype
  --------------------  --------------------  ---------------
  labels                (207,)                int64
  mc_ess                (207, 500)            float32
  ml_av                 (207, 500)            float32
  ml_cov_sar            (207, 500, 3, 3)      float32
  ml_rv                 (207, 500)            float32
  ml_scale              (207, 500)            float32
  model_idx             (207, 500)            int32
  obj_Nbands            (207,)                int16
  obj_chi2min           (207,)                float32
  obj_log_evid          (207,)                float32
  obj_log_post          (207, 500)            float32
  samps_dist            (207, 500)            float32
  samps_dred            (207, 500)            float32
  samps_logp            (207, 500)            float32
  samps_red             (207, 500)            float32
Section 2: Understanding Output Arrays
The main datasets stored in a BruteForce results file are:
Per-sample arrays (shape (Nobj, Ndraws))
Dataset |
Description |
|---|---|
|
Model grid index for each posterior sample |
|
Maximum-likelihood distance scale factor |
|
Maximum-likelihood extinction |
|
Maximum-likelihood reddening curve shape |
|
Local covariance matrix for |
|
Log-posterior value for each draw |
|
Monte Carlo weight-concentration diagnostic ( |
The “Monte Carlo weights” section of the Understanding results page
explains how to read mc_ess.
Pre-computed distance/reddening draws (shape (Nobj, Ndraws))
These are generated during the fit by the Monte Carlo prior-integration
step in logpost_grid, which samples in log-distance space (with the
galactic-structure and parallax priors applied as weights):
Dataset |
Description |
|---|---|
|
Posterior distance samples (kpc) |
|
Posterior reddening |
|
Posterior differential reddening |
|
Log-weights for the distance/reddening samples |
Per-object summary arrays (shape (Nobj,))
Dataset |
Description |
|---|---|
|
Minimum chi-squared across all models |
|
Number of photometric bands used |
|
Log-evidence (marginal likelihood) |
|
Object labels from input data |
The scale factor s relates to physical distance as
\(d_{\rm kpc} = 1 / \sqrt{s}\), i.e. s = 1 / d_kpc**2.
The pre-computed samps_dist array already stores distances in kpc,
so in most workflows you can use it directly rather than converting from
ml_scale.
The covariance matrix ml_cov_sar captures the local curvature of the
likelihood surface around the ML (s, A_V, R_V) for each model sample.
This is used by draw_sar to generate Monte Carlo realizations from
the posterior in post-processing (see Section 4).
if DATA_AVAILABLE:
    Nobj, Ndraws = results["ml_scale"].shape
    print(f"Objects: {Nobj}, Draws per object: {Ndraws}\n")
    print(f"  {'Array':14s}  {'Shape':18s}  {'Min':>10s}  {'Median':>10s}  {'Max':>10s}")
    print(f"  {'-'*14}  {'-'*18}  {'-'*10}  {'-'*10}  {'-'*10}")
    for key in ["ml_scale", "ml_av", "ml_rv", "samps_dist", "samps_red", "samps_dred", "obj_chi2min", "obj_log_evid"]:
        arr = results[key]
        fin = arr[np.isfinite(arr)]
        print(f"  {key:14s}  {str(arr.shape):18s}  {fin.min():10.3f}  {np.median(fin):10.3f}  {fin.max():10.3f}")
Objects: 207, Draws per object: 500

  Array           Shape                      Min      Median         Max
  --------------  ------------------  ----------  ----------  ----------
  ml_scale        (207, 500)               0.000       0.968     300.831
  ml_av           (207, 500)               0.000       3.050       8.001
  ml_rv           (207, 500)               1.000       2.888       5.800
  samps_dist      (207, 500)               0.060       0.996     507.419
  samps_red       (207, 500)               0.000       3.694       7.136
  samps_dred      (207, 500)               1.531       2.899       4.987
  obj_chi2min     (207,)                   0.625      16.216     655.664
  obj_log_evid    (207,)               -1603.713     128.519     163.537
Section 3: Computing Posterior Summaries
Distance posteriors can be obtained from the pre-computed Monte Carlo draws or from the per-draw maximum-likelihood scale factors:
Pre-computed samples (
samps_dist,samps_red,samps_dred). Posterior draws generated during the fit by the Monte Carlo prior-integration step inlogpost_grid, which samples in log-distance space and applies the Galactic structure and parallax priors. Use these arrays for standard posterior summaries.ML estimates (
ml_scale,ml_av,ml_rv). Per-draw maximum-likelihood values before distance and parallax prior reweighting, where \(d_{\mathrm{kpc}} = 1/\sqrt{s}\) and \(s = 1/d_{\mathrm{kpc}}^2\).
Below we compute medians and 68% credible intervals (16th to 84th
percentiles) using brutus.utils.quantile.
from brutus.utils import quantile

if not DATA_AVAILABLE:
    print("SKIPPED -- results file not available.")
else:
    q_levels = np.array([0.16, 0.50, 0.84])

    # --- Approach 1: Use pre-computed samps_dist / samps_red / samps_dred ---
    samps_dist = results["samps_dist"]   # kpc
    samps_red = results["samps_red"]     # A_V
    samps_dred = results["samps_dred"]   # R_V

    Nobj = samps_dist.shape[0]

    # Storage for summaries
    dist_lo = np.full(Nobj, np.nan)
    dist_med = np.full(Nobj, np.nan)
    dist_hi = np.full(Nobj, np.nan)
    av_lo = np.full(Nobj, np.nan)
    av_med = np.full(Nobj, np.nan)
    av_hi = np.full(Nobj, np.nan)
    rv_lo = np.full(Nobj, np.nan)
    rv_med = np.full(Nobj, np.nan)
    rv_hi = np.full(Nobj, np.nan)

    for i in range(Nobj):
        # Distance (already in kpc)
        d_i = samps_dist[i]
        good = np.isfinite(d_i) & (d_i > 0)
        if np.sum(good) > 1:
            q = quantile(d_i[good], q_levels)
            dist_lo[i], dist_med[i], dist_hi[i] = q

        # A_V
        av_i = samps_red[i]
        good_av = np.isfinite(av_i)
        if np.sum(good_av) > 1:
            q = quantile(av_i[good_av], q_levels)
            av_lo[i], av_med[i], av_hi[i] = q

        # R_V
        rv_i = samps_dred[i]
        good_rv = np.isfinite(rv_i)
        if np.sum(good_rv) > 1:
            q = quantile(rv_i[good_rv], q_levels)
            rv_lo[i], rv_med[i], rv_hi[i] = q

    # Print a table for the first 10 objects
    n_show = min(10, Nobj)
    print("Using pre-computed samps_dist / samps_red / samps_dred:\n")
    print(f"{'Obj':>5s}  {'d_med (kpc)':>12s}  {'d_lo':>8s}  {'d_hi':>8s}  "
          f"{'AV_med':>8s}  {'AV_lo':>8s}  {'AV_hi':>8s}  "
          f"{'RV_med':>8s}")
    print(f"{'---':>5s}  {'----------':>12s}  {'----':>8s}  {'----':>8s}  "
          f"{'------':>8s}  {'-----':>8s}  {'-----':>8s}  "
          f"{'------':>8s}")
    for i in range(n_show):
        print(
            f"{i:5d}  {dist_med[i]:12.3f}  {dist_lo[i]:8.3f}  {dist_hi[i]:8.3f}  "
            f"{av_med[i]:8.3f}  {av_lo[i]:8.3f}  {av_hi[i]:8.3f}  "
            f"{rv_med[i]:8.3f}"
        )

    print(f"\n... ({Nobj} objects total)")

    # Global summary
    valid_d = np.isfinite(dist_med)
    print(f"\nGlobal distance summary ({np.sum(valid_d)} valid objects):")
    print(f"  Median distance: {np.nanmedian(dist_med):.3f} kpc")
    print(f"  Range: [{np.nanmin(dist_med):.3f}, {np.nanmax(dist_med):.3f}] kpc")

    # --- Approach 2: Convert ml_scale manually (for reference) ---
    # Scale factor: s = 1/d_kpc^2, so d_kpc = 1/sqrt(s)
    print("\n--- Manual conversion from ml_scale (for reference) ---")
    scales = results["ml_scale"]
    s_med = np.nanmedian(scales, axis=1)
    good_s = np.isfinite(s_med) & (s_med > 0)
    d_from_scale = np.full(Nobj, np.nan)
    d_from_scale[good_s] = 1.0 / np.sqrt(s_med[good_s])  # kpc
    print(f"  Median distance from ml_scale: {np.nanmedian(d_from_scale):.3f} kpc")
    print(f"  (cf. samps_dist median: {np.nanmedian(dist_med):.3f} kpc)")
    print("  These differ because samps_dist incorporates the distance and"
          "  parallax priors applied during the fit's MC integration.")
  Obj   d_med (kpc)      d_lo      d_hi    AV_med     AV_lo     AV_hi    RV_med
  ---    ----------      ----      ----    ------     -----     -----    ------
    0         0.286     0.282     0.290     0.242     0.090     0.582     3.351
    1         1.223     1.148     1.327     5.248     5.127     5.353     2.489
    2         1.000     0.892     1.127     5.684     5.499     5.897     2.709
    3         0.364     0.357     0.369     1.281     0.070     1.813     3.389
    4         1.007     0.860     1.187     5.302     5.101     5.483     2.696
    5         0.662     0.436     0.762     6.673     6.139     6.877     4.067
    6         7.039     4.575    10.695     4.287     4.089     4.474     2.803
    7         0.802     0.746     0.850     4.501     4.375     4.623     2.662
    8         0.497     0.458     0.552     5.712     5.367     6.100     2.521
    9         1.383     1.179     1.967     3.216     2.930     3.461     3.026
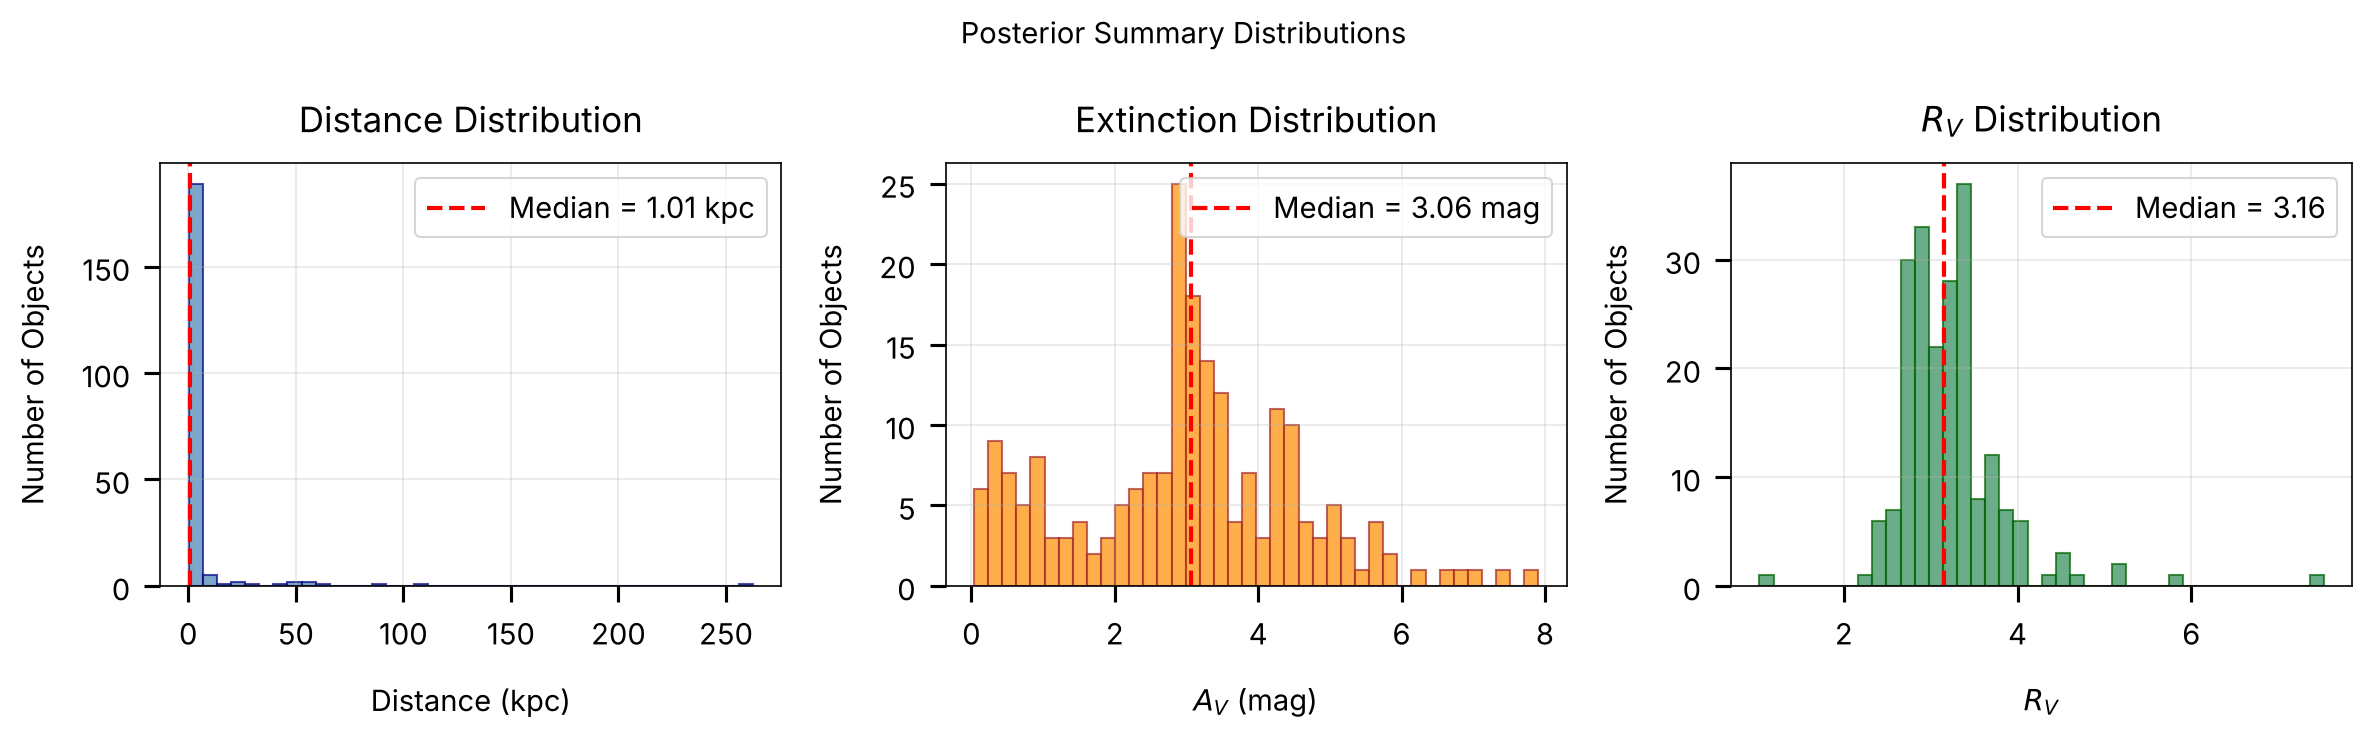
... (207 objects total; median distance = 1.009 kpc, range [0.187, 262.543] kpc)
# Plot a distance histogram
if DATA_AVAILABLE:
    fig, axes = plt.subplots(1, 3, figsize=(16, 5))

    # Panel 1: Distance distribution
    ax = axes[0]
    valid_d = dist_med[np.isfinite(dist_med)]
    ax.hist(valid_d, bins=40, alpha=0.7, color="steelblue", edgecolor="navy")
    ax.axvline(
        np.median(valid_d), color="red", ls="--", lw=2,
        label=f"Median = {np.median(valid_d):.2f} kpc"
    )
    ax.set_xlabel("Distance (kpc)")
    ax.set_ylabel("Number of Objects")
    ax.set_title("Distance Distribution")
    ax.legend()
    ax.grid(True, alpha=0.3)

    # Panel 2: A_V distribution
    ax = axes[1]
    valid_av = av_med[np.isfinite(av_med)]
    ax.hist(valid_av, bins=40, alpha=0.7, color="darkorange", edgecolor="brown")
    ax.axvline(
        np.median(valid_av), color="red", ls="--", lw=2,
        label=f"Median = {np.median(valid_av):.2f} mag"
    )
    ax.set_xlabel(r"$A_V$ (mag)")
    ax.set_ylabel("Number of Objects")
    ax.set_title("Extinction Distribution")
    ax.legend()
    ax.grid(True, alpha=0.3)

    # Panel 3: R_V distribution
    ax = axes[2]
    valid_rv = rv_med[np.isfinite(rv_med)]
    ax.hist(valid_rv, bins=40, alpha=0.7, color="seagreen", edgecolor="darkgreen")
    ax.axvline(
        np.median(valid_rv), color="red", ls="--", lw=2,
        label=f"Median = {np.median(valid_rv):.2f}"
    )
    ax.set_xlabel(r"$R_V$")
    ax.set_ylabel("Number of Objects")
    ax.set_title(r"$R_V$ Distribution")
    ax.legend()
    ax.grid(True, alpha=0.3)

    plt.suptitle("Posterior Summary Distributions", fontsize=14)
    save_figure(fig, 11, "posterior_summaries")
    plt.show()

else:
    print("SKIPPED -- results file not available.")
Section 4: Sampling from Posteriors
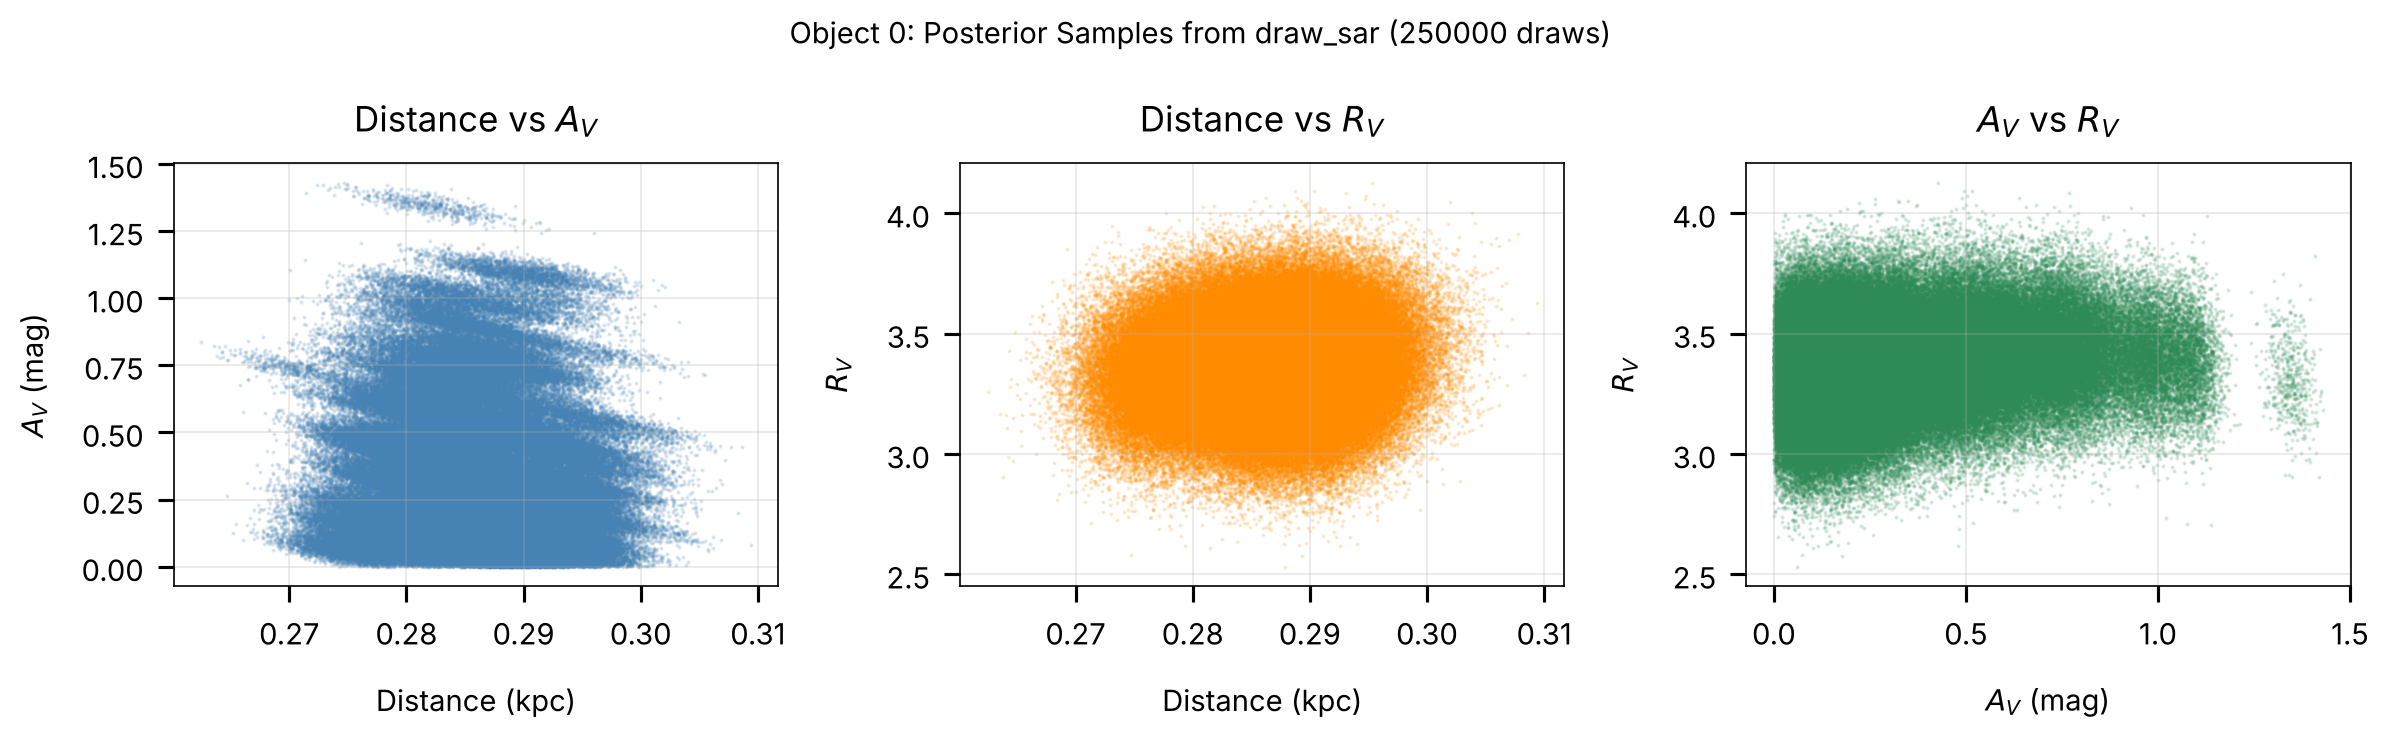
The draw_sar function generates Monte Carlo draws from the joint
(s, A_V, R_V) posterior for a single object. It uses the per-sample
ML estimates (ml_scale, ml_av, ml_rv) and local covariance matrices
ml_cov_sar, drawing from multivariate normals and rejection-sampling
to enforce physical bounds on A_V and R_V.
This is the standard way to generate posterior realizations for downstream analysis (e.g., propagating uncertainties into derived quantities like absolute magnitude or bolometric luminosity).
Function signature
draw_sar(scales, avs, rvs, covs_sar, ndraws=500,
         avlim=(0., 20.), rvlim=(1., 8.), rstate=None,
         max_attempts=10000)
Returns (sdraws, adraws, rdraws) each of shape (Nsamps, ndraws).
Convert scale draws to distance via d_kpc = 1/sqrt(s).
All Nsamps distributions are drawn in a single batched call per
rejection pass. The accepted draws follow the same truncated Gaussian
distribution as in older brutus versions, though individual draws differ
because the batched RNG stream is ordered differently. If a distribution has
not accumulated ndraws in-bounds samples after max_attempts rejection
passes, the remaining slots are filled with the mean values and a warning is
emitted.
from brutus.utils import draw_sar

if not DATA_AVAILABLE:
    print("SKIPPED -- results file not available.")
else:
    # Pick one example object
    obj_idx = 0

    scales_obj = results["ml_scale"][obj_idx]
    avs_obj = results["ml_av"][obj_idx]
    rvs_obj = results["ml_rv"][obj_idx]
    covs_obj = results["ml_cov_sar"][obj_idx]

    print(f"Object {obj_idx}:")
    print(f"  ml_scale shape : {scales_obj.shape}")
    print(f"  ml_av shape    : {avs_obj.shape}")
    print(f"  ml_rv shape    : {rvs_obj.shape}")
    print(f"  ml_cov_sar shape: {covs_obj.shape}")

    # Draw 500 (s, A_V, R_V) realizations per sample
    ndraws = 500
    sdraws, adraws, rdraws = draw_sar(
        scales_obj, avs_obj, rvs_obj, covs_obj, ndraws=ndraws
    )

    print(f"\nDraw shapes:")
    print(f"  sdraws: {sdraws.shape}")
    print(f"  adraws: {adraws.shape}")
    print(f"  rdraws: {rdraws.shape}")

    # Flatten draws across all per-model samples
    s_flat = sdraws.ravel()
    a_flat = adraws.ravel()
    r_flat = rdraws.ravel()

    # Convert scale to distance: s = 1/d_kpc^2, so d_kpc = 1/sqrt(s)
    good = np.isfinite(s_flat) & (s_flat > 0)
    d_flat = np.full_like(s_flat, np.nan)
    d_flat[good] = 1.0 / np.sqrt(s_flat[good])  # kpc

    print(f"\nTotal draws (flattened): {len(s_flat)}")
    print(f"  Distance: median = {np.nanmedian(d_flat):.3f} kpc")
    print(f"  A_V     : median = {np.nanmedian(a_flat):.3f} mag")
    print(f"  R_V     : median = {np.nanmedian(r_flat):.3f}")

    # Compare with pre-computed samps_dist
    print(f"\nComparison with pre-computed samps_dist:")
    print(f"  samps_dist median: {np.nanmedian(results['samps_dist'][obj_idx]):.3f} kpc")
    print(f"  draw_sar median  : {np.nanmedian(d_flat):.3f} kpc")
Object 0: ml_scale=(500,), ml_av=(500,), ml_rv=(500,), ml_cov_sar=(500, 3, 3)
Total draws (flattened 500 x 500): 250,000
  Distance: median = 0.287 kpc  (cf. samps_dist median = 0.286 kpc)
  A_V     : median = 0.241 mag
  R_V     : median = 3.362
# Corner-like scatter plot of the drawn posterior samples
if DATA_AVAILABLE:
    fig, axes = plt.subplots(1, 3, figsize=(16, 5))

    # Use only finite draws
    mask_good = np.isfinite(d_flat) & np.isfinite(a_flat) & np.isfinite(r_flat)
    d_plot = d_flat[mask_good]
    a_plot = a_flat[mask_good]
    r_plot = r_flat[mask_good]

    # Panel 1: Distance vs A_V
    ax = axes[0]
    ax.scatter(d_plot, a_plot, s=1, alpha=0.15, color="steelblue")
    ax.set_xlabel("Distance (kpc)")
    ax.set_ylabel(r"$A_V$ (mag)")
    ax.set_title(r"Distance vs $A_V$")
    ax.grid(True, alpha=0.3)

    # Panel 2: Distance vs R_V
    ax = axes[1]
    ax.scatter(d_plot, r_plot, s=1, alpha=0.15, color="darkorange")
    ax.set_xlabel("Distance (kpc)")
    ax.set_ylabel(r"$R_V$")
    ax.set_title(r"Distance vs $R_V$")
    ax.grid(True, alpha=0.3)

    # Panel 3: A_V vs R_V
    ax = axes[2]
    ax.scatter(a_plot, r_plot, s=1, alpha=0.15, color="seagreen")
    ax.set_xlabel(r"$A_V$ (mag)")
    ax.set_ylabel(r"$R_V$")
    ax.set_title(r"$A_V$ vs $R_V$")
    ax.grid(True, alpha=0.3)

    plt.suptitle(
        f"Object {obj_idx}: Posterior Samples from draw_sar "
        f"({len(d_plot)} draws)",
        fontsize=14,
    )
    save_figure(fig, 11, "draw_sar_scatter")
    plt.show()

else:
    print("SKIPPED -- results file not available.")
Section 5: Photometric Conversions
BruteForce operates internally on linear flux densities (maggies)
rather than magnitudes. The utility functions magnitude and inv_magnitude
convert between the two representations:
Below we verify the round-trip conversion and inspect the Orion input photometry in both representations.
from brutus.utils import magnitude, inv_magnitude

# Demonstrate round-trip on synthetic data
np.random.seed(42)
mag_synth = np.random.uniform(14, 22, size=(5, 4))
magerr_synth = np.random.uniform(0.01, 0.1, size=(5, 4))

flux_synth, fluxerr_synth = inv_magnitude(mag_synth, magerr_synth)
mag_recov, magerr_recov = magnitude(flux_synth, fluxerr_synth)

residual = np.max(np.abs(mag_synth - mag_recov))
print(f"Round-trip mag -> flux -> mag:")
print(f"  Max |mag residual| = {residual:.2e}")
assert np.allclose(mag_synth, mag_recov, atol=1e-12), "Round-trip failed"
print("  Round-trip verified: exact to machine precision.")

# Load input photometry if available
PHOT_AVAILABLE = False
try:
    import h5py

    phot_path = find_brutus_data_file("Orion_l209.1_b-19.9.h5")
    with h5py.File(phot_path, "r") as f:
        fpix = f["photometry"]["pixel 0-0"]
        input_mag = fpix["mag"][:]
        input_magerr = fpix["err"][:]
        input_flux, input_fluxerr = inv_magnitude(input_mag, input_magerr)
        input_mask = np.isfinite(input_magerr)

    PHOT_AVAILABLE = True
    print(f"\nLoaded input photometry from {Path(phot_path).name}")
    print(f"  Objects: {input_flux.shape[0]}, Filters: {input_flux.shape[1]}")
    print(f"  Example (object 0):")
    print(f"    Magnitudes: {input_mag[0]}")
    print(f"    Fluxes    : {input_flux[0]}")
except (FileNotFoundError, ImportError) as exc:
    print(f"\nInput photometry file not found (optional).")
    print(f"  ({exc})")
Round-trip mag -> flux -> mag: max |residual| = 3.55e-15
Loaded input photometry from Orion_l209.1_b-19.9.h5 (207 objects, 8 filters)
Section 6: Visualization
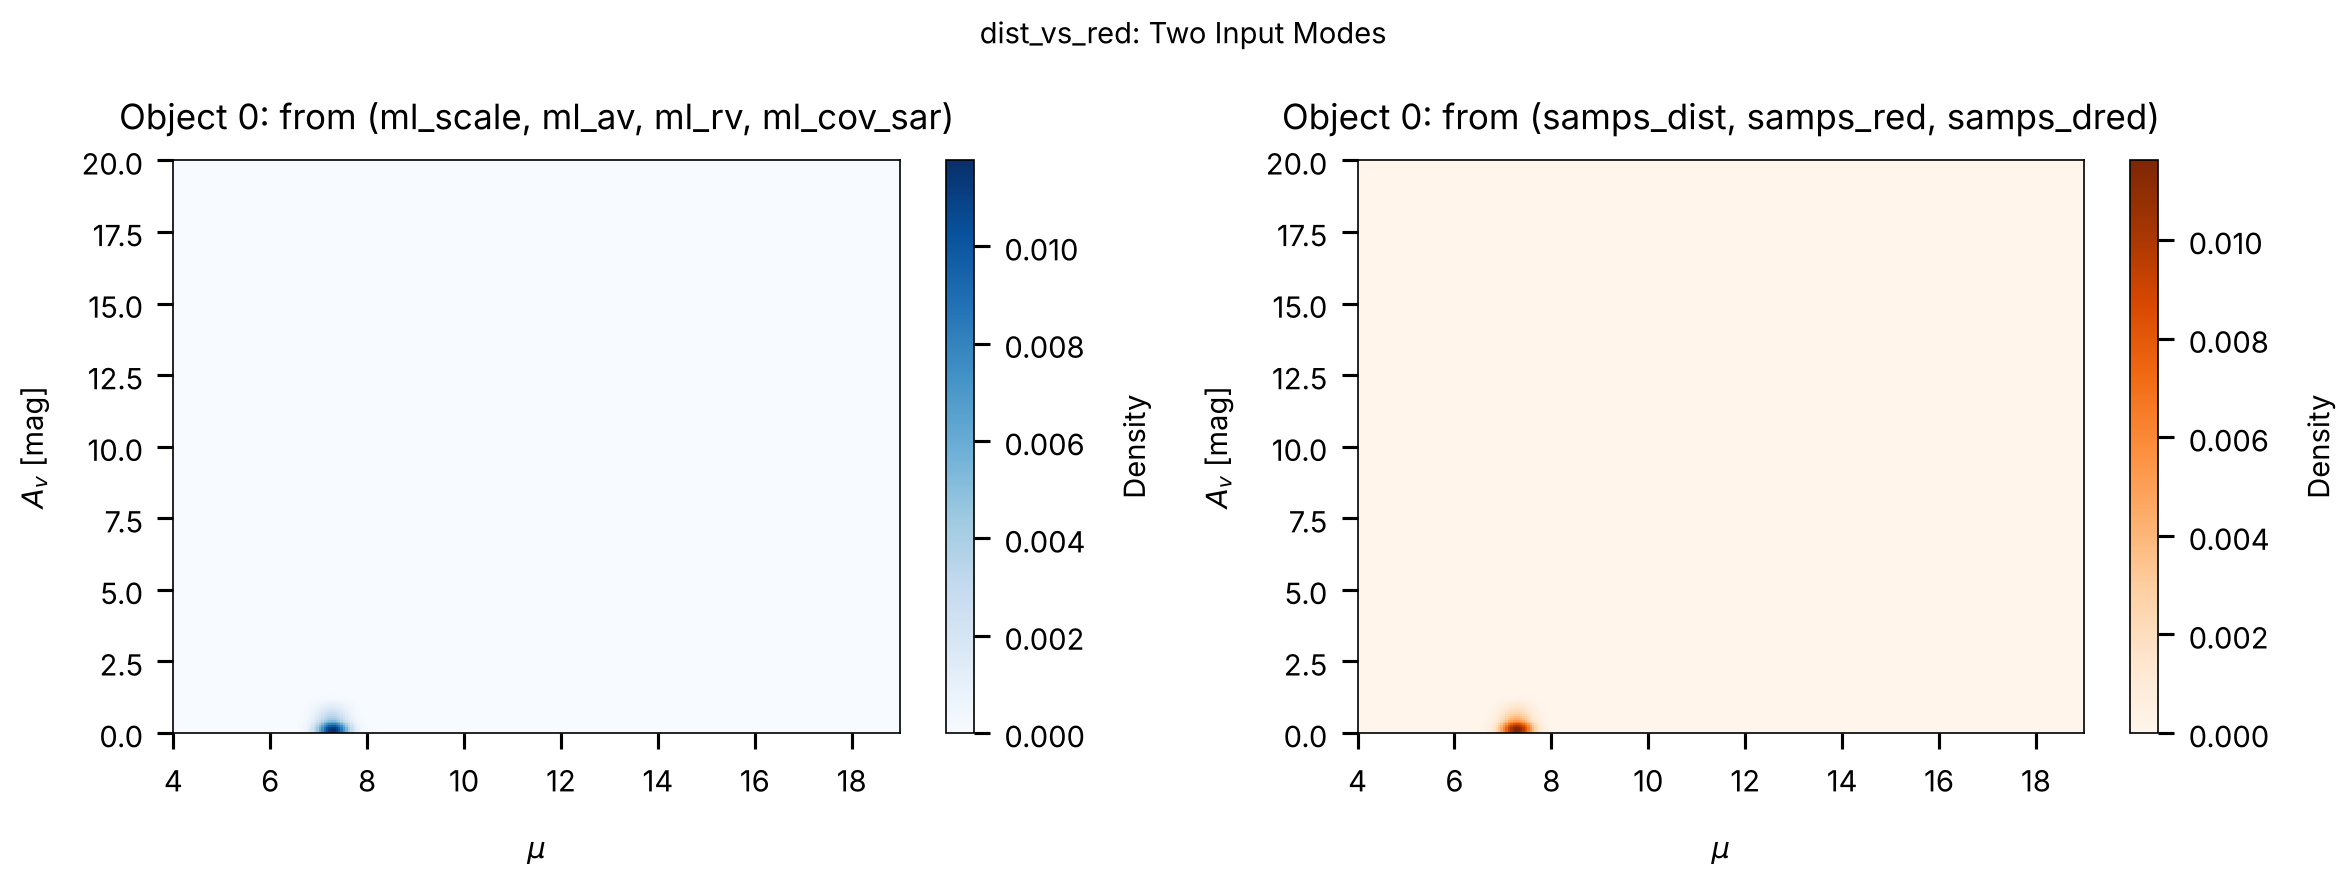
brutus.plotting provides dist_vs_red and cornerplot for inspecting
BruteForce posteriors:
dist_vs_red: Plots the 2-D density of the joint distance-reddening posterior for a single object ((Nsamps,)) or averaged across multiple objects ((Nobj, Nsamps)).cornerplot: Plots 1-D and 2-D marginals across stellar grid labels, \(A_V\), \(R_V\), parallax, and distance (see Tutorial 10 for a full worked example):
fig, axes = cornerplot(
    results["model_idx"][idx],
    (results["ml_scale"][idx], results["ml_av"][idx],
     results["ml_rv"][idx], results["ml_cov_sar"][idx]),
    grid_labels,  # from load_models()
    coord=(l, b),
    parallax=plx,
    parallax_err=plx_err,
    show_titles=True,
)
from brutus.plotting import dist_vs_red

if not DATA_AVAILABLE:
    print("SKIPPED -- results file not available.")
else:
    obj_idx = 0

    # dist_vs_red accepts either a 4-tuple (scales, avs, rvs, covs_sar)
    # or a 3-tuple (dists, reds, dreds) of pre-computed samples.
    # Here we demonstrate both approaches.

    # Approach 1: 4-tuple with ML estimates and covariances
    # (dist_vs_red will call draw_sar internally)
    data_tuple_4 = (
        results["ml_scale"][obj_idx],
        results["ml_av"][obj_idx],
        results["ml_rv"][obj_idx],
        results["ml_cov_sar"][obj_idx],
    )

    # Approach 2: 3-tuple with pre-computed distance/reddening draws
    data_tuple_3 = (
        results["samps_dist"][obj_idx],
        results["samps_red"][obj_idx],
        results["samps_dred"][obj_idx],
    )

    # Use the Orion field centre as a default coordinate
    coord = (209.1, -19.9)

    fig, axes = plt.subplots(1, 2, figsize=(16, 6))

    # Panel 1: 4-tuple (ML + covariance -> internal draw_sar)
    plt.sca(axes[0])
    try:
        H1, xe1, ye1, img1 = dist_vs_red(
            data_tuple_4,
            coord=coord,
            dist_type="distance_modulus",
            cmap="Blues",
            smooth=(0.015, 0.005),
            bins=300,
        )
        axes[0].set_title(f"Object {obj_idx}: from (ml_scale, ml_av, ml_rv, ml_cov_sar)")
        plt.colorbar(img1, ax=axes[0], label="Density")
    except Exception as exc:
        axes[0].text(0.5, 0.5, f"Error: {exc}", ha="center", va="center",
                     transform=axes[0].transAxes, fontsize=9)
        axes[0].set_title("4-tuple approach (failed)")

    # Panel 2: 3-tuple (pre-computed samples)
    plt.sca(axes[1])
    try:
        H2, xe2, ye2, img2 = dist_vs_red(
            data_tuple_3,
            coord=coord,
            dist_type="distance_modulus",
            cmap="Oranges",
            smooth=(0.015, 0.005),
            bins=300,
        )
        axes[1].set_title(f"Object {obj_idx}: from (samps_dist, samps_red, samps_dred)")
        plt.colorbar(img2, ax=axes[1], label="Density")
    except Exception as exc:
        axes[1].text(0.5, 0.5, f"Error: {exc}", ha="center", va="center",
                     transform=axes[1].transAxes, fontsize=9)
        axes[1].set_title("3-tuple approach (failed)")

    plt.suptitle("dist_vs_red: Two Input Modes", fontsize=14)
    save_figure(fig, 11, "dist_vs_red_demo")
    plt.show()
Section 7: Quality Assessment
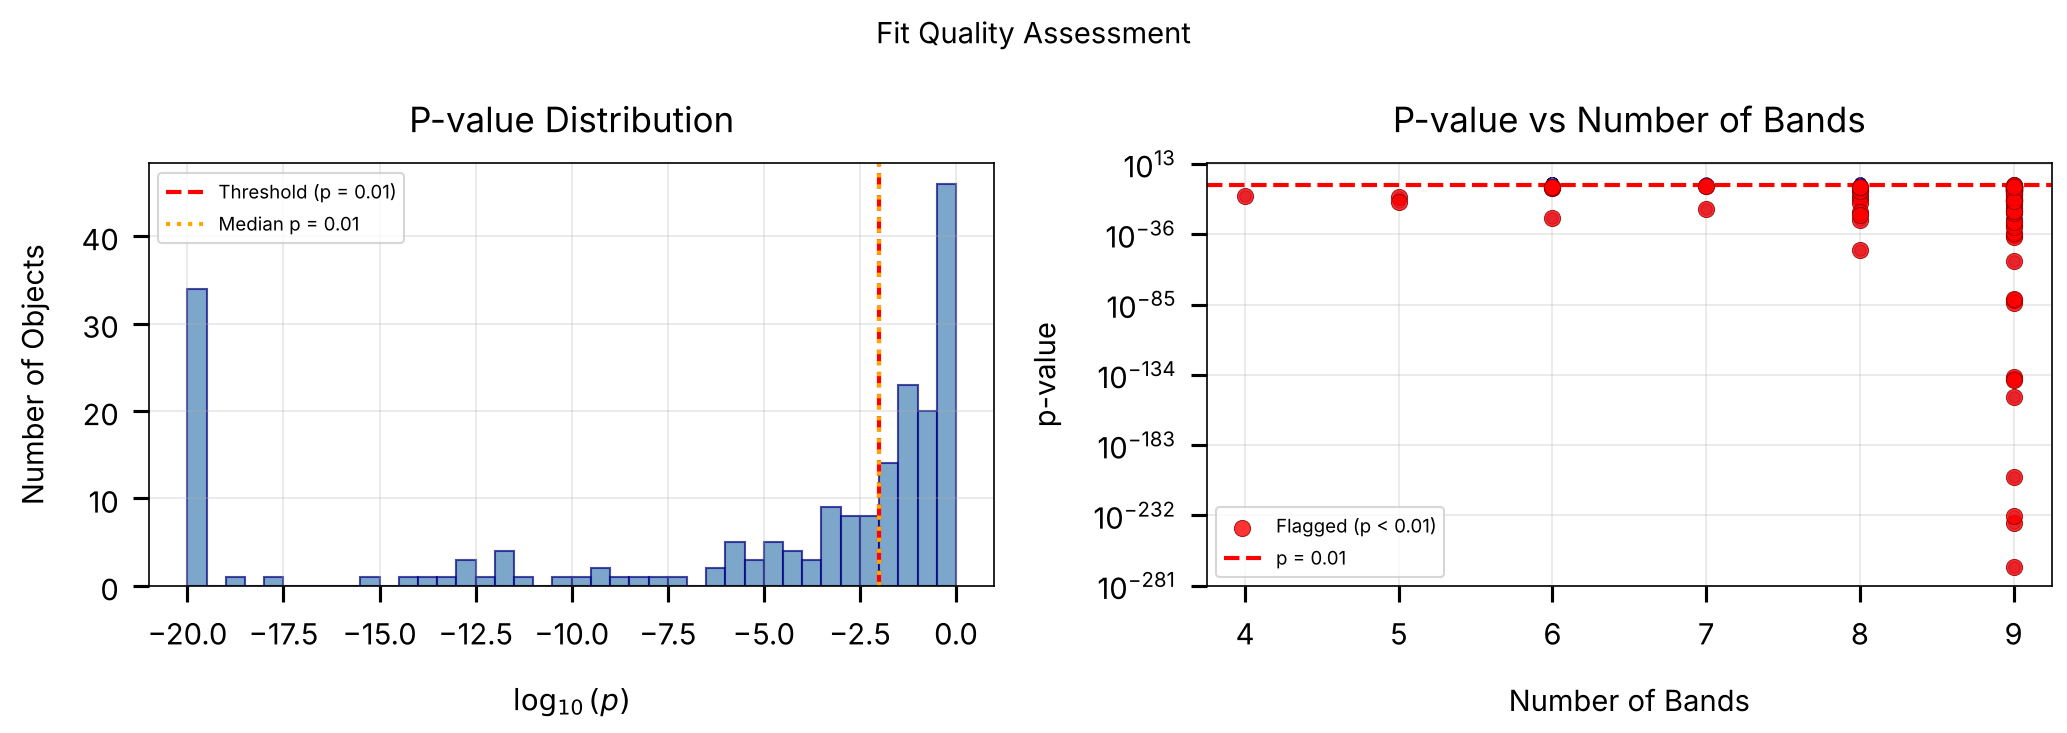
The primary diagnostic for BruteForce results is the p-value derived
from the chi-squared distribution. Given the best-fit obj_chi2min and
the degrees of freedom dof = Nbands - 3 (three analytically
marginalized parameters: s, A_V, R_V), we compute:
where \(F_{\chi^2}\) is the chi-squared CDF. Small p-values indicate that the observed chi-squared is improbably large under the model, flagging objects that are poorly fit (e.g., binaries, galaxies, problematic photometry).
Why not reduced chi-squared?
While the reduced chi-squared \(\chi^2_\nu = \chi^2/\mathrm{dof}\) is convenient for quick visual checks, it is not variance-stabilizing because its sampling variance is \(2/\mathrm{dof}\). A fixed threshold such as \(\chi^2_\nu > 3\) is too lenient for objects with many bands (where \(\chi^2_\nu\) concentrates tightly around 1) and overly strict for objects with few bands (where the distribution is broad). Thresholding on the \(p\)-value gives a uniform false-positive rate across all band counts.
Log-evidence
The output also includes obj_log_evid, an approximate log-evidence
(marginal likelihood) computed from the grid-based Laplace
approximation. This quantity is useful for relative model
comparison (such as comparing how well a MIST grid fits a given star
relative to an alternative stellar model grid) rather than as a standalone
goodness-of-fit metric.
from scipy.stats import chi2 as chi2_dist

if not DATA_AVAILABLE:
    print("SKIPPED -- results file not available.")
else:
    chi2 = results["obj_chi2min"]
    Nbands = results["obj_Nbands"]

    # Degrees of freedom: 3 free parameters (s, A_V, R_V)
    n_free = 3
    dof = Nbands - n_free

    # Flag objects with insufficient bands
    insufficient = dof <= 0
    valid = ~insufficient & np.isfinite(chi2)

    print(f"Total objects          : {len(chi2)}")
    print(f"Objects with dof > 0   : {np.sum(~insufficient)}")
    print(f"Objects with dof <= 0  : {np.sum(insufficient)} (too few bands)")

    # Compute p-values from the chi-squared survival function
    pvalues = np.full(len(chi2), np.nan)
    pvalues[valid] = chi2_dist.sf(chi2[valid], dof[valid])

    if np.sum(valid) > 0:
        print(f"\nP-value summary (from chi2 CDF):")
        print(f"  Min     : {np.nanmin(pvalues[valid]):.2e}")
        print(f"  Median  : {np.nanmedian(pvalues[valid]):.3f}")
        print(f"  Max     : {np.nanmax(pvalues[valid]):.3f}")

        # Outlier flagging via p-value threshold
        p_thresh = 0.01
        outliers = valid & (pvalues < p_thresh)
        n_outliers = np.sum(outliers)
        pct_outliers = 100.0 * n_outliers / np.sum(valid)

        print(f"\nOutlier flagging (p < {p_thresh}):")
        print(f"  Flagged : {n_outliers} / {np.sum(valid)} ({pct_outliers:.1f}%)")

        good_fits = valid & (pvalues >= p_thresh)
        print(f"  Good fits: {np.sum(good_fits)} ({100.0 * np.sum(good_fits) / np.sum(valid):.1f}%)")

        # Show the flagged objects
        if n_outliers > 0:
            flagged_idx = np.where(outliers)[0]
            print(f"\n  Flagged objects:")
            print(f"  {'Obj':>5s}  {'chi2':>8s}  {'Nbands':>6s}  {'dof':>4s}  {'chi2/dof':>9s}  {'p-value':>10s}")
            for idx in flagged_idx[:5]:
                print(f"  {idx:5d}  {chi2[idx]:8.2f}  {Nbands[idx]:6d}  {dof[idx]:4d}  "
                      f"{chi2[idx]/dof[idx]:9.2f}  {pvalues[idx]:10.2e}")
            if len(flagged_idx) > 5:
                print(f"  ... ({len(flagged_idx) - 5} more flagged objects)")

        # For comparison: show why reduced chi2 thresholds are unreliable
        chi2_dof = chi2[valid] / dof[valid].astype(float)
        print(f"\nFor reference, reduced chi2 (chi2/dof) statistics:")
        print(f"  Median  : {np.median(chi2_dof):.3f}")
        print(f"  Note: The variance of chi2/dof is 2/dof, so a fixed")
        print(f"  threshold means different things at different Nbands.")

    # Log-evidence summary
    print(f"\nLog-evidence (obj_log_evid) summary:")
    lnz = results["obj_log_evid"]
    finite_lnz = lnz[np.isfinite(lnz)]
    if len(finite_lnz) > 0:
        print(f"  Min   : {np.min(finite_lnz):.2f}")
        print(f"  Median: {np.median(finite_lnz):.2f}")
        print(f"  Max   : {np.max(finite_lnz):.2f}")
        print(f"  Note: Useful for relative model comparison (e.g., MIST vs")
        print(f"  alternative grids), not as a standalone quality metric.")
    else:
        print("  (all non-finite)")
Total objects: 207 (all with dof > 0)
P-value summary (from chi2 CDF): min = 0.00e+00, median = 0.010, max = 0.999

Outlier flagging (p < 0.01):
  Flagged  : 104 / 207 (50.2%)
  Good fits: 103 / 207 (49.8%)

  First 5 flagged objects:
    Obj      chi2  Nbands   dof   chi2/dof     p-value
      1     40.17       9     6       6.69    4.22e-07
      2     33.08       9     6       5.51    1.01e-05
      4     33.74       9     6       5.62    7.54e-06
      5     46.69       9     6       7.78    2.15e-08
      6     51.25       9     6       8.54    2.64e-09
  ... (99 more flagged objects)

Log-evidence (obj_log_evid): min = -1603.71, median = 128.52, max = 163.54
# P-value quality assessment plots
if DATA_AVAILABLE and np.sum(valid) > 0:
    fig, axes = plt.subplots(1, 2, figsize=(14, 5))

    # Panel 1: P-value histogram (log scale)
    ax = axes[0]
    pvals_plot = pvalues[valid]
    # Use log10(p) for better visualization of the distribution
    log_pvals = np.log10(np.clip(pvals_plot, 1e-20, 1.0))
    ax.hist(
        log_pvals, bins=40, alpha=0.7,
        color="steelblue", edgecolor="navy"
    )
    ax.axvline(
        np.log10(p_thresh), color="red", ls="--", lw=2,
        label=f"Threshold (p = {p_thresh})"
    )
    ax.axvline(
        np.log10(np.median(pvals_plot)), color="orange", ls=":", lw=2,
        label=f"Median p = {np.median(pvals_plot):.2f}"
    )
    ax.set_xlabel(r"$\log_{10}(p)$")
    ax.set_ylabel("Number of Objects")
    ax.set_title("P-value Distribution")
    ax.legend(fontsize=9)
    ax.grid(True, alpha=0.3)

    # Panel 2: P-value vs number of bands
    ax = axes[1]
    ax.scatter(
        Nbands[valid], pvalues[valid],
        s=30, alpha=0.6, color="steelblue", edgecolor="navy", lw=0.5
    )
    # Highlight flagged objects
    if np.sum(outliers) > 0:
        ax.scatter(
            Nbands[outliers], pvalues[outliers],
            s=60, alpha=0.8, color="red", edgecolor="darkred", lw=0.5,
            label=f"Flagged (p < {p_thresh})", zorder=5
        )
    ax.axhline(
        p_thresh, color="red", ls="--", lw=2,
        label=f"p = {p_thresh}"
    )
    ax.set_xlabel("Number of Bands")
    ax.set_ylabel("p-value")
    ax.set_yscale("log")
    ax.set_title("P-value vs Number of Bands")
    ax.legend(fontsize=9)
    ax.grid(True, alpha=0.3)

    plt.suptitle("Fit Quality Assessment", fontsize=14)
    save_figure(fig, 11, "chi2_quality")
    plt.show()
Summary
Key Steps
Loading. Use
load_example_results()or open the HDF5 file directly withh5pyto inspect dataset keys, shapes, and data types.Output arrays. Per-sample arrays (
model_idx,ml_scale,ml_av,ml_rv,ml_cov_sar), pre-computed draws (samps_dist,samps_red,samps_dred), and per-object summaries (obj_chi2min,obj_Nbands,obj_log_evid).Posterior summaries. Use
samps_dist,samps_red, andsamps_dredfor prior-weighted posterior samples, or convertml_scalemanually viad_kpc = 1/sqrt(s). Compute quantiles withbrutus.utils.quantile.Posterior sampling.
draw_sargenerates Monte Carlo draws from the joint(s, A_V, R_V)distribution using the stored covariance matrices.Photometric conversions.
magnitudeandinv_magnitudeconvert between linear flux (maggies) and magnitudes in the survey’s native system.Visualization.
dist_vs_redplots the 2-D distance-reddening posterior from either 4-tuple or 3-tuple inputs;cornerplotplots full multi-parameter marginals using the model grid labels.Quality assessment. Compute \(p\)-values from
obj_chi2minvia the \(\chi^2\) survival function (scipy.stats.chi2.sf) with \(\mathrm{dof} = N_{\text{bands}} - 3\) to obtain a uniform false-positive rate across band counts.