Tutorial 6: Cluster Analysis
brutus.analysis.populations fits coeval isochrone models to multi-band stellar cluster photometry and parallaxes, inferring cluster metallicity, age, extinction, distance, field contamination, and binary fraction.
Topics Covered
Loading cluster data (M67 / NGC 2682 catalog)
Isochrone fitting with
isochrone_population_loglikeCluster parameters (age, metallicity, distance, extinction)
MCMC sampling for cluster parameters including binary fraction
Binary fraction inference from photometric data
Posterior visualization (corner plots, trace plots)
Prerequisites
The setup cell below checks the data files this tutorial needs; Tutorial 00 shows how to download them.
Requirement: The MCMC sections use the
emceesampler (pip install emcee).
# Imports and setup
import numpy as np
import matplotlib.pyplot as plt
from pathlib import Path
import warnings
warnings.filterwarnings('ignore')

from tutorial_utils import (
    setup_tutorial,
    print_saved_files,
    find_brutus_data_file,
    save_figure as _save_fig,
    print_section,
    load_m67_data,
)

info = setup_tutorial(6, title="Tutorial 06: Cluster Analysis")


def save_figure(fig, name):
    """Save figure to this tutorial's plot directory."""
    _save_fig(fig, 6, name)
from brutus.utils import inv_magnitude
from brutus.data import filters

# Load M67 data
data_dict = load_m67_data()
fdata = data_dict['data']
Nobj = len(fdata)
print(f"  Loaded {Nobj} sources")

# ---- Define the combined filter set: Gaia + PS1(grizy) + 2MASS ----
# This gives 11 bands spanning optical through near-IR.
combined_filters = filters.gaia + filters.ps[:5] + filters.tmass
n_filters = len(combined_filters)
print(f"  Using {n_filters} filters: {combined_filters}")

# ---- Column names in the FITS catalogue ----
mag_columns = [
    # Gaia DR2 (revised passband)
    'Gaia_G_DR2Rev', 'Gaia_BP_DR2Rev', 'Gaia_RP_DR2Rev',
    # Pan-STARRS grizy
    'PS_g', 'PS_r', 'PS_i', 'PS_z', 'PS_y',
    # 2MASS JHKs
    '2MASS_J', '2MASS_H', '2MASS_Ks',
]
err_columns = [c + '_Err' for c in mag_columns]

# ---- Convert calibrated magnitudes to maggies ----
# brutus works in "maggie" units: flux = 10^(-0.4 * mag), with no
# zero-point offset.  inv_magnitude handles NaN gracefully.
all_mag = np.column_stack([fdata[c] for c in mag_columns])
all_magerr = np.column_stack([fdata[c] for c in err_columns])

phot, err = inv_magnitude(all_mag, all_magerr)

# Add a 2% systematic error floor (accounts for model systematics)
err = np.sqrt(err**2 + (0.02 * phot)**2)
mask = np.isfinite(phot) & (err > 0) & (phot > 0)

# Replace NaN/invalid values with safe placeholders for masked bands.
# The mask tells the likelihood to skip these, but phot_loglike needs
# finite values everywhere to avoid NaN propagation (NaN * 0 = NaN).
phot = np.where(mask, phot, 1.0)
err = np.where(mask, err, 1.0)

# Band availability summary
band_names = ['G', 'BP', 'RP', 'g_PS', 'r_PS', 'i_PS', 'z_PS', 'y_PS', 'J', 'H', 'Ks']

# ---- Parallax (with Gaia DR2 zero-point correction) ----
parallax = fdata['Parallax'] + 0.054          # Lindegren et al. 2018
parallax_err = np.sqrt(fdata['Parallax_Err']**2 + 0.043**2)

# ---- Membership probability ----
try:
    pmem = fdata['HDBscan_MemProb']
    print("\n  Found membership probabilities")
except Exception:
    pmem = np.ones(Nobj)
    print("\n  No membership info, assuming all are members")

# ---- Quality cuts ----
# Require: at least 4 valid bands (consistent with Tutorial 5),
# high membership probability, and a valid parallax measurement.
gaia_g = all_mag[:, 0]
n_valid_bands = np.sum(mask, axis=1)
quality = (
    (pmem > 0.5)
    & (n_valid_bands >= 4)
    & np.isfinite(parallax)
)

# Store Gaia mags for CMD plotting later
gaia_mag = all_mag[:, :3]

print(f"\nHigh-confidence members: {quality.sum()} / {Nobj}")
print(f"  Median valid bands per star: {np.median(n_valid_bands[quality]):.0f}")
print(f"  Mean parallax: {np.nanmean(parallax[quality]):.3f} "
      f"+/- {np.nanstd(parallax[quality]):.3f} mas")
print(f"  Implied distance: {1000 / np.nanmean(parallax[quality]):.0f} pc")
Loaded 1585 sources across 11 filters (Gaia DR2 + Pan-STARRS + 2MASS)
High-confidence members: 753 / 1585
  Median valid bands per star: 11
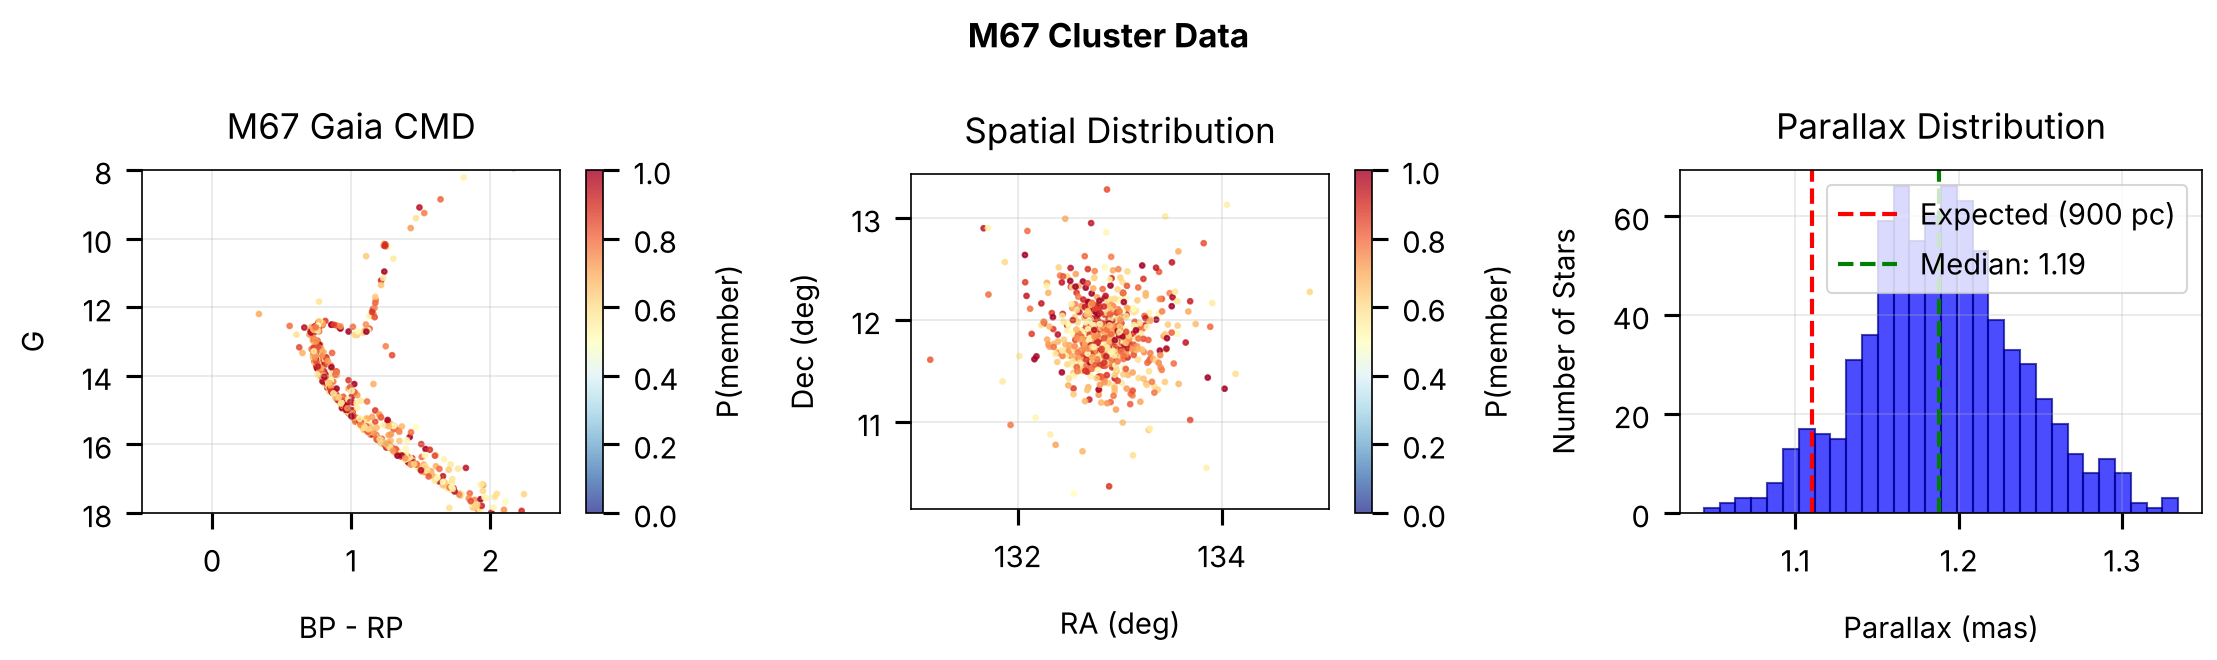
  Mean parallax: 1.189 +/- 0.048 mas (implied distance: 841 pc)
# Extract auxiliary columns for plotting
try:
    ra = fdata['gaia_dr2_source.ra']
    dec = fdata['gaia_dr2_source.dec']
except Exception:
    ra = np.full(Nobj, np.nan)
    dec = np.full(Nobj, np.nan)

# Package selected data for analysis
cluster_data = {
    'phot': phot[quality],
    'err': err[quality],
    'mask': mask[quality],
    'parallax': parallax[quality],
    'parallax_err': parallax_err[quality],
    'pmem': pmem[quality],
}

n_stars = len(cluster_data['phot'])
cluster_prob = np.mean(cluster_data['pmem'])

print(f"Data ready for analysis: {n_stars} stars, cluster_prob = {cluster_prob:.3f}")
Data ready for analysis: 753 stars, cluster_prob = 0.741
# Visualize cluster data
fig, axes = plt.subplots(1, 3, figsize=(15, 4.5))

# Gaia magnitudes for CMD plotting (indices 0,1,2 = G, BP, RP)
bp_rp = gaia_mag[:, 1] - gaia_mag[:, 2]
g = gaia_mag[:, 0]

# Panel 1: Gaia CMD
ax = axes[0]
scatter = ax.scatter(bp_rp[quality], g[quality],
                    c=pmem[quality], s=5, cmap='RdYlBu_r',
                    vmin=0, vmax=1, alpha=0.8)
ax.set_xlabel('BP - RP')
ax.set_ylabel('G')
ax.set_title('M67 Gaia CMD')
ax.invert_yaxis()
ax.set_xlim(-0.5, 2.5)
ax.set_ylim(18, 8)
plt.colorbar(scatter, ax=ax, label='P(member)')
ax.grid(True, alpha=0.3)

# Panel 2: Spatial distribution
ax = axes[1]
try:
    ra = fdata['gaia_dr2_source.ra']
    dec = fdata['gaia_dr2_source.dec']
except Exception:
    ra = np.full(Nobj, np.nan)
    dec = np.full(Nobj, np.nan)
scatter = ax.scatter(ra[quality], dec[quality], c=pmem[quality],
                    s=5, cmap='RdYlBu_r', vmin=0, vmax=1, alpha=0.8)
ax.set_xlabel('RA (deg)')
ax.set_ylabel('Dec (deg)')
ax.set_title('Spatial Distribution')
ax.set_aspect('equal')
plt.colorbar(scatter, ax=ax, label='P(member)')
ax.grid(True, alpha=0.3)

# Panel 3: Parallax distribution
ax = axes[2]
valid_plx = quality & np.isfinite(parallax)
ax.hist(parallax[valid_plx], bins=30, alpha=0.7, color='blue', edgecolor='darkblue')
ax.axvline(1.11, color='red', ls='--', lw=2, label='Expected (900 pc)')
ax.axvline(np.median(parallax[valid_plx]), color='green', ls='--', lw=2,
           label=f'Median: {np.median(parallax[valid_plx]):.2f}')
ax.set_xlabel('Parallax (mas)')
ax.set_ylabel('Number of Stars')
ax.set_title('Parallax Distribution')
ax.legend()
ax.grid(True, alpha=0.3)

plt.suptitle('M67 Cluster Data', fontsize=16, fontweight='bold')
plt.tight_layout()
save_figure(fig, 'cluster_data')
plt.show()
# Load isochrone models and set up population fitting
from brutus.core import Isochrone, StellarPop
from brutus.analysis import isochrone_population_loglike

# Load data files
mistfile = find_brutus_data_file('MIST_1.2_iso_vvcrit0.0.h5')
nnfile = find_brutus_data_file('nn_c3k.h5')

# Initialize models with combined filter set (Gaia + PS1 + 2MASS = 11 bands)
iso = Isochrone(mistfile=mistfile, verbose=False)
stellarpop = StellarPop(iso, nnfile=nnfile, filters=combined_filters, verbose=False)

print(f"  Isochrone file: {Path(mistfile).name}")
print(f"  NN file: {Path(nnfile).name}")
print(f"  Filters ({n_filters}): {combined_filters}")
print(f"  Model ready for population analysis")
  Isochrone file: MIST_1.2_iso_vvcrit0.0.h5
  NN file: nn_c3k.h5
  Filters (11): ['Gaia_G_MAW', 'Gaia_BP_MAWf', 'Gaia_RP_MAW', 'PS_g', 'PS_r', 'PS_i', 'PS_z', 'PS_y', '2MASS_J', '2MASS_H', '2MASS_Ks']
# Initial guess for M67 parameters
# isochrone_population_loglike expects theta = [feh, loga, av, rv, dist, field_frac]
theta_init = [
    0.0,    # [Fe/H] - solar metallicity
    9.55,   # log(age) ~ 3.5 Gyr
    0.05,   # A(V) - small extinction
    3.32,   # R(V) - standard
    900.0,  # distance (pc)
    0.05,   # field_frac - field contamination fraction
]

lnl_init = isochrone_population_loglike(
    theta_init,
    stellarpop,
    cluster_data['phot'],
    cluster_data['err'],
    parallax=cluster_data['parallax'],
    parallax_err=cluster_data['parallax_err'],
    cluster_prob=cluster_prob,
    mask=cluster_data['mask'],
)

print(f"\nInitial parameters:")
print(f"  [Fe/H] = {theta_init[0]:.2f}")
print(f"  Age = {10**(theta_init[1]-9):.2f} Gyr")
print(f"  A(V) = {theta_init[2]:.3f}")
print(f"  R(V) = {theta_init[3]:.2f}")
print(f"  Distance = {theta_init[4]:.0f} pc")
print(f"  Field fraction = {theta_init[5]:.2f}")
print(f"\nInitial log-likelihood: {lnl_init:.1f}")
Initial parameters: [Fe/H]=0.00, Age=3.55 Gyr, A(V)=0.050, R(V)=3.32, d=900 pc, f_field=0.05
Initial log-likelihood: -8722.5
# Optimize cluster parameters using Powell's method
from scipy.optimize import minimize

from brutus.utils.math import LOG_ZERO

def neg_loglike(theta):
    """Negative log-likelihood for optimization."""
    lnl = isochrone_population_loglike(
        theta,
        stellarpop,
        cluster_data['phot'],
        cluster_data['err'],
        parallax=cluster_data['parallax'],
        parallax_err=cluster_data['parallax_err'],
        cluster_prob=cluster_prob,
        mask=cluster_data['mask'],
    )
    if lnl <= LOG_ZERO:  # failed computation
        return 1e30
    return -lnl

# Set reasonable bounds
bounds = [
    (-0.5, 0.5),    # [Fe/H]
    (9.0, 10.0),    # log(age)
    (0.0, 0.5),     # A(V)
    (2.0, 5.0),     # R(V)
    (700, 1100),    # distance (pc)
    (0.0, 0.5),     # field_frac
]

# Optimize
result = minimize(
    neg_loglike,
    theta_init,
    method='Powell',
    bounds=bounds,
    options={'maxiter': 100, 'ftol': 1.0}
)

theta_best = result.x
lnl_best = -result.fun

print(f"\nOptimization complete ({result.nfev} evaluations)")
print(f"  Final log-likelihood: {lnl_best:.1f}")
print(f"  Improvement over initial: {lnl_best - lnl_init:.1f}")
print("\nBest-fit parameters:")
print(f"  [Fe/H] = {theta_best[0]:+.3f}")
print(f"  Age = {10**(theta_best[1]-9):.2f} Gyr  (log(age) = {theta_best[1]:.3f})")
print(f"  A(V) = {theta_best[2]:.3f}  ->  E(B-V) ~ {theta_best[2]/theta_best[3]:.3f}")
print(f"  R(V) = {theta_best[3]:.2f}")
print(f"  Distance = {theta_best[4]:.0f} pc")
print(f"  Field fraction = {theta_best[5]:.3f}")
Optimization complete (83 evaluations)
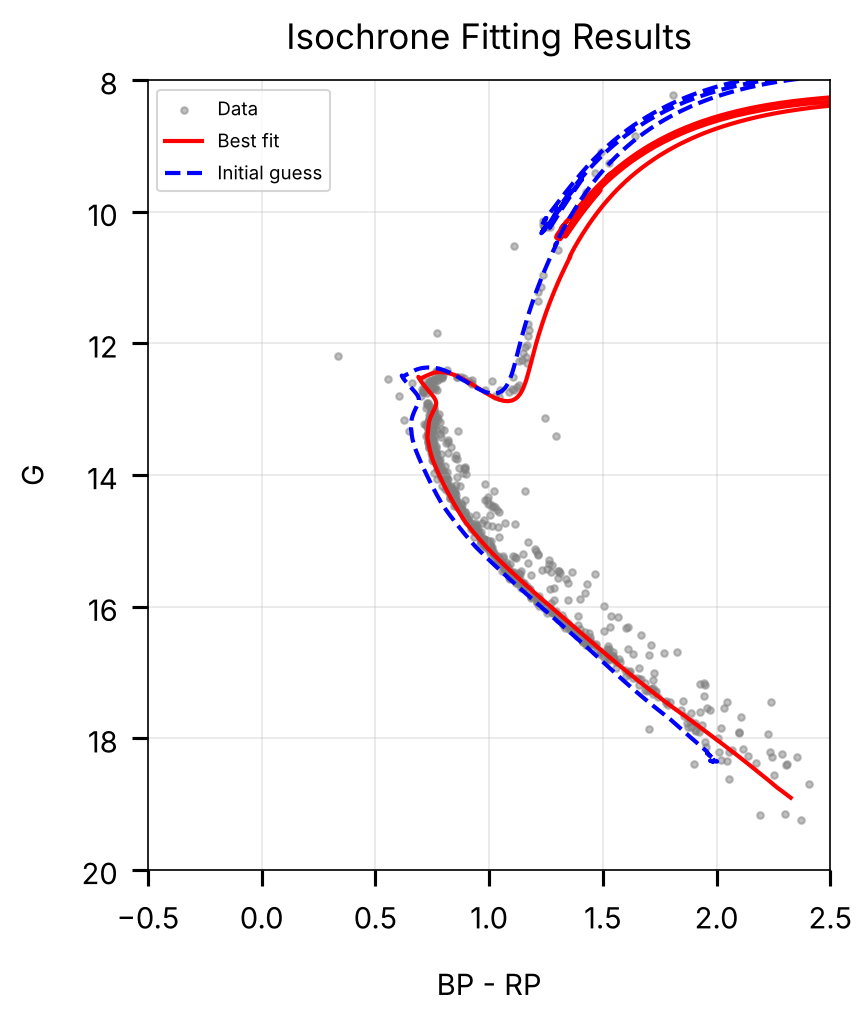
  Final log-likelihood: -8074.9  (improvement: +647.6)

Best-fit parameters:
  [Fe/H]         = +0.179
  Age            = 3.57 Gyr  (log(age) = 9.553)
  A(V)           = 0.075     (E(B-V) ~ 0.023)
  R(V)           = 3.33
  Distance       = 903 pc
  Field fraction = 0.000
# Generate best-fit isochrone for visualization
eep_grid = np.linspace(202, 808, 2000)

# Gaia band indices in the combined filter array
iG, iBP, iRP = 0, 1, 2

# Get photometry from StellarPop for best-fit parameters
mags_best, _, _ = stellarpop.get_seds(
    feh=theta_best[0], afe=0.0, loga=theta_best[1], eep=eep_grid,
    av=theta_best[2], rv=theta_best[3], dist=theta_best[4],
    binary_fraction=0.0,
)

# Also generate the initial-guess isochrone for comparison
mags_init, _, _ = stellarpop.get_seds(
    feh=theta_init[0], afe=0.0, loga=theta_init[1], eep=eep_grid,
    av=theta_init[2], rv=theta_init[3], dist=theta_init[4],
    binary_fraction=0.0,
)

# Observed CMD colors (Gaia bands for plotting)
gaia_mag_q = gaia_mag[quality]
bp_rp_obs = gaia_mag_q[:, 1] - gaia_mag_q[:, 2]
g_obs = gaia_mag_q[:, 0]

# CMD with best-fit and initial isochrones
fig, ax = plt.subplots(figsize=(6, 7))
ax.scatter(bp_rp_obs, g_obs, s=10, alpha=0.5, color='gray', label='Data')

# Best-fit isochrone (use Gaia bands from 11-band SED)
valid_best = np.all(np.isfinite(mags_best[:, [iG, iBP, iRP]]), axis=1)
ax.plot(mags_best[valid_best, iBP] - mags_best[valid_best, iRP],
        mags_best[valid_best, iG], 'r-', lw=2, label='Best fit')

# Initial guess isochrone
valid_init = np.all(np.isfinite(mags_init[:, [iG, iBP, iRP]]), axis=1)
ax.plot(mags_init[valid_init, iBP] - mags_init[valid_init, iRP],
        mags_init[valid_init, iG], 'b--', lw=2, label='Initial guess')

ax.set_xlabel('BP - RP')
ax.set_ylabel('G')
ax.set_title('Isochrone Fitting Results')
ax.invert_yaxis()
ax.set_xlim(-0.5, 2.5)
ax.set_ylim(20, 8)
ax.legend(fontsize=9)
ax.grid(True, alpha=0.3)

plt.tight_layout()
save_figure(fig, 'isochrone_fitting')
plt.show()
Section 3: MCMC Sampling with Binary Fraction
Point optimization locates the maximum-likelihood cluster parameters, whereas MCMC sampling recovers the full joint posterior over all cluster parameters including the binary fraction.
Unresolved binaries affect cluster CMDs by:
Broadening the main sequence (binaries appear brighter than single stars)
Creating sequences above the single-star main sequence
Affecting the turnoff luminosity and inferred age
Rather than assuming a fixed binary fraction, we can fit it as a free parameter alongside age, metallicity, distance, and extinction. The key idea is that isochrone_population_loglike internally marginalizes over a grid of secondary mass fractions (SMF). By adjusting the relative weighting of single-star (SMF=0) vs. binary (SMF>0) grid points, we control the effective binary fraction.
We will use emcee to sample the 7-dimensional parameter space:
[Fe/H], log(age), A(V), R(V), distance, field_fraction, binary_fraction
# MCMC sampling of cluster parameters including binary fraction
import emcee
from brutus.analysis.populations import (
    generate_isochrone_population_grid,
    compute_isochrone_cluster_loglike,
    compute_isochrone_outlier_loglike,
    apply_isochrone_mixture_model,
    marginalize_isochrone_grid,
)

# ---- Parameter labels and bounds ----
param_names = ['[Fe/H]', 'log(age)', 'A(V)', 'R(V)',
               'distance', 'field_frac', 'binary_frac']
bounds = np.array([
    [-0.5,  0.5],    # [Fe/H]
    [ 9.0, 10.0],    # log(age)
    [ 0.0,  0.5],    # A(V)
    [ 2.0,  5.0],    # R(V)
    [700., 1100.],   # distance (pc)
    [ 0.001, 0.5],   # field_frac (avoid log(0))
    [ 0.0,  1.0],    # binary_frac
])

# ---- Log-likelihood that includes binary_fraction ----
# The standard isochrone_population_loglike marginalizes over an SMF grid
# where SMF=0 represents single stars and SMF>0 represents binaries with
# various mass ratios.  By default, the SMF grid is uniformly weighted.
#
# To incorporate binary_fraction, we:
#   1. Generate the isochrone grid (with SMF values from 0 to 1)
#   2. Re-weight the SMF jacobians:
#      - SMF=0 points get weight proportional to (1 - f_binary)
#      - SMF>0 points get weight proportional to f_binary
#   3. Compute the rest of the likelihood as usual

# Pre-compute the SMF and EEP grids (shared across all evaluations)
smf_grid = np.linspace(0.0, 1.0, 21)
eep_grid = np.linspace(202.0, 808.0, 500)

def log_likelihood_with_binary(theta7):
    """Log-likelihood for 7 parameters including binary fraction."""
    feh, loga, av, rv, dist, field_frac, binary_frac = theta7

    # Check bounds
    for val, (lo, hi) in zip(theta7, bounds):
        if val < lo or val > hi:
            return -np.inf

    # Step 1: Generate isochrone grid
    grid = generate_isochrone_population_grid(
        stellarpop, feh, loga, av, rv, dist,
        smf_grid=smf_grid, eep_grid=eep_grid,
    )

    # Step 2: Re-weight SMF jacobians by binary fraction
    # Points with SMF=0 are single stars: weight = (1 - binary_frac)
    # Points with SMF>0 are binaries: weight = binary_frac
    smf_vals = grid['smf_values']
    smf_jac = grid['smf_jacobians'].copy()

    # Post-MS rows (EEP > eep_binary_max) are SMF-independent: the grid
    # stores them once carrying the FULL SMF measure (sum of all grid
    # spacings), and no companion is modeled for them, so their weight
    # must not depend on the binary fraction. Identify them by that
    # full measure and leave their jacobians unchanged.
    total_smf_measure = np.sum(np.gradient(smf_grid))
    is_postms = np.isclose(smf_jac, total_smf_measure)

    is_single = (smf_vals == 0.0) & ~is_postms
    is_binary = (smf_vals > 0.0) & ~is_postms

    # Original total SMF weight for normalization
    n_binary_smf = np.sum(smf_grid > 0)
    smf_spacing = smf_grid[1] - smf_grid[0] if len(smf_grid) > 1 else 1.0

    # Re-weight: single stars get (1 - f_b), binaries get f_b
    # The binary SMF points share the f_b weight, keeping their
    # relative spacing (so uniform mass-ratio prior is preserved).
    if np.any(is_single):
        smf_jac[is_single] = (1.0 - binary_frac)
    if np.any(is_binary) and n_binary_smf > 0:
        smf_jac[is_binary] = binary_frac * smf_jac[is_binary] / (
            n_binary_smf * smf_spacing
        )

    grid['smf_jacobians'] = smf_jac

    # Step 3: Compute cluster likelihood
    lnl_cluster = compute_isochrone_cluster_loglike(
        cluster_data['phot'], cluster_data['err'], grid,
        parallax=cluster_data['parallax'],
        parallax_err=cluster_data['parallax_err'],
        distance=dist, mask=cluster_data['mask'],
    )

    # Step 4: Compute outlier likelihood
    lnl_outlier = compute_isochrone_outlier_loglike(
        cluster_data['phot'], cluster_data['err'], grid,
        parallax=cluster_data['parallax'],
        parallax_err=cluster_data['parallax_err'],
        mask=cluster_data['mask'],
    )

    # Step 5: Apply mixture model (cluster vs. field)
    lnl_mixture = apply_isochrone_mixture_model(
        lnl_cluster, lnl_outlier, cluster_prob, field_frac,
    )

    # Step 6: Marginalize over (mass, SMF) and sum over objects
    lnl_marg = marginalize_isochrone_grid(
        lnl_mixture, grid['mass_jacobians'], grid['smf_jacobians'],
    )
    lnl_total = np.sum(lnl_marg)

    if not np.isfinite(lnl_total):
        return -np.inf
    return lnl_total


def log_prior(theta7):
    """Flat priors within bounds, plus a Gaussian prior on R(V)."""
    for val, (lo, hi) in zip(theta7, bounds):
        if val < lo or val > hi:
            return -np.inf
    # Gaussian prior on R(V): mean=3.32, sigma=0.18
    rv = theta7[3]
    lnp = -0.5 * ((rv - 3.32) / 0.18)**2
    return lnp

def log_posterior(theta7):
    """Log-posterior = log-prior + log-likelihood."""
    lp = log_prior(theta7)
    if not np.isfinite(lp):
        return -np.inf
    ll = log_likelihood_with_binary(theta7)
    if not np.isfinite(ll):
        return -np.inf
    return lp + ll

# ---- Initialize walkers around the optimized solution ----
ndim = 7
nwalkers = 28  # 4 * ndim

# Start from the optimizer result, adding binary_frac = 0.3
theta0_7 = np.array([
    theta_best[0], theta_best[1], theta_best[2],
    theta_best[3], theta_best[4], theta_best[5],
    0.3,  # initial guess for binary fraction
])

# Small perturbations around the best-fit
rng = np.random.default_rng(42)
p0 = theta0_7[None, :] + rng.normal(0, 1, size=(nwalkers, ndim)) * np.array([
    0.02,   # [Fe/H]
    0.01,   # log(age)
    0.005,  # A(V)
    0.05,   # R(V)
    10.0,   # distance
    0.01,   # field_frac
    0.05,   # binary_frac
])

# Clip to bounds
for i in range(ndim):
    p0[:, i] = np.clip(p0[:, i], bounds[i, 0] + 1e-6, bounds[i, 1] - 1e-6)

# ---- Run MCMC ----
print(f"Running emcee: {nwalkers} walkers, {ndim} parameters")
print(f"  Parameters: {param_names}")
print(f"  Initial binary_frac guess: 0.3\n")

# Short run for the tutorial (increase nsteps for production)
nsteps_burn = 40
nsteps_prod = 60

sampler = emcee.EnsembleSampler(nwalkers, ndim, log_posterior)

# Burn-in
print(f"  Burn-in: {nsteps_burn} steps...")
state = sampler.run_mcmc(p0, nsteps_burn, progress=False)
sampler.reset()

# Production
print(f"  Production: {nsteps_prod} steps...")
sampler.run_mcmc(state, nsteps_prod, progress=False)

# ---- Report results ----
samples = sampler.get_chain(flat=True)
print(f"\n  Total samples: {samples.shape[0]}")
print(f"  Mean acceptance fraction: {np.mean(sampler.acceptance_fraction):.3f}")

print("\nPosterior summary (median +/- 1-sigma):")
print("-" * 55)
for i, name in enumerate(param_names):
    q16, q50, q84 = np.percentile(samples[:, i], [16, 50, 84])
    lo = q50 - q16
    hi = q84 - q50
    if name == 'distance':
        print(f"  {name:>12s} = {q50:8.1f}  +{hi:.1f}  -{lo:.1f}")
    else:
        print(f"  {name:>12s} = {q50:8.4f}  +{hi:.4f}  -{lo:.4f}")

# Highlight binary fraction result
bf_q16, bf_q50, bf_q84 = np.percentile(samples[:, 6], [16, 50, 84])
print(f"\n  --> Binary fraction = {bf_q50:.2f} "
      f"(+{bf_q84 - bf_q50:.2f} / -{bf_q50 - bf_q16:.2f})")
Running emcee: 28 walkers, 7 parameters (40 burn-in + 60 production steps)
  Total samples: 1680
  Mean acceptance fraction: 0.351

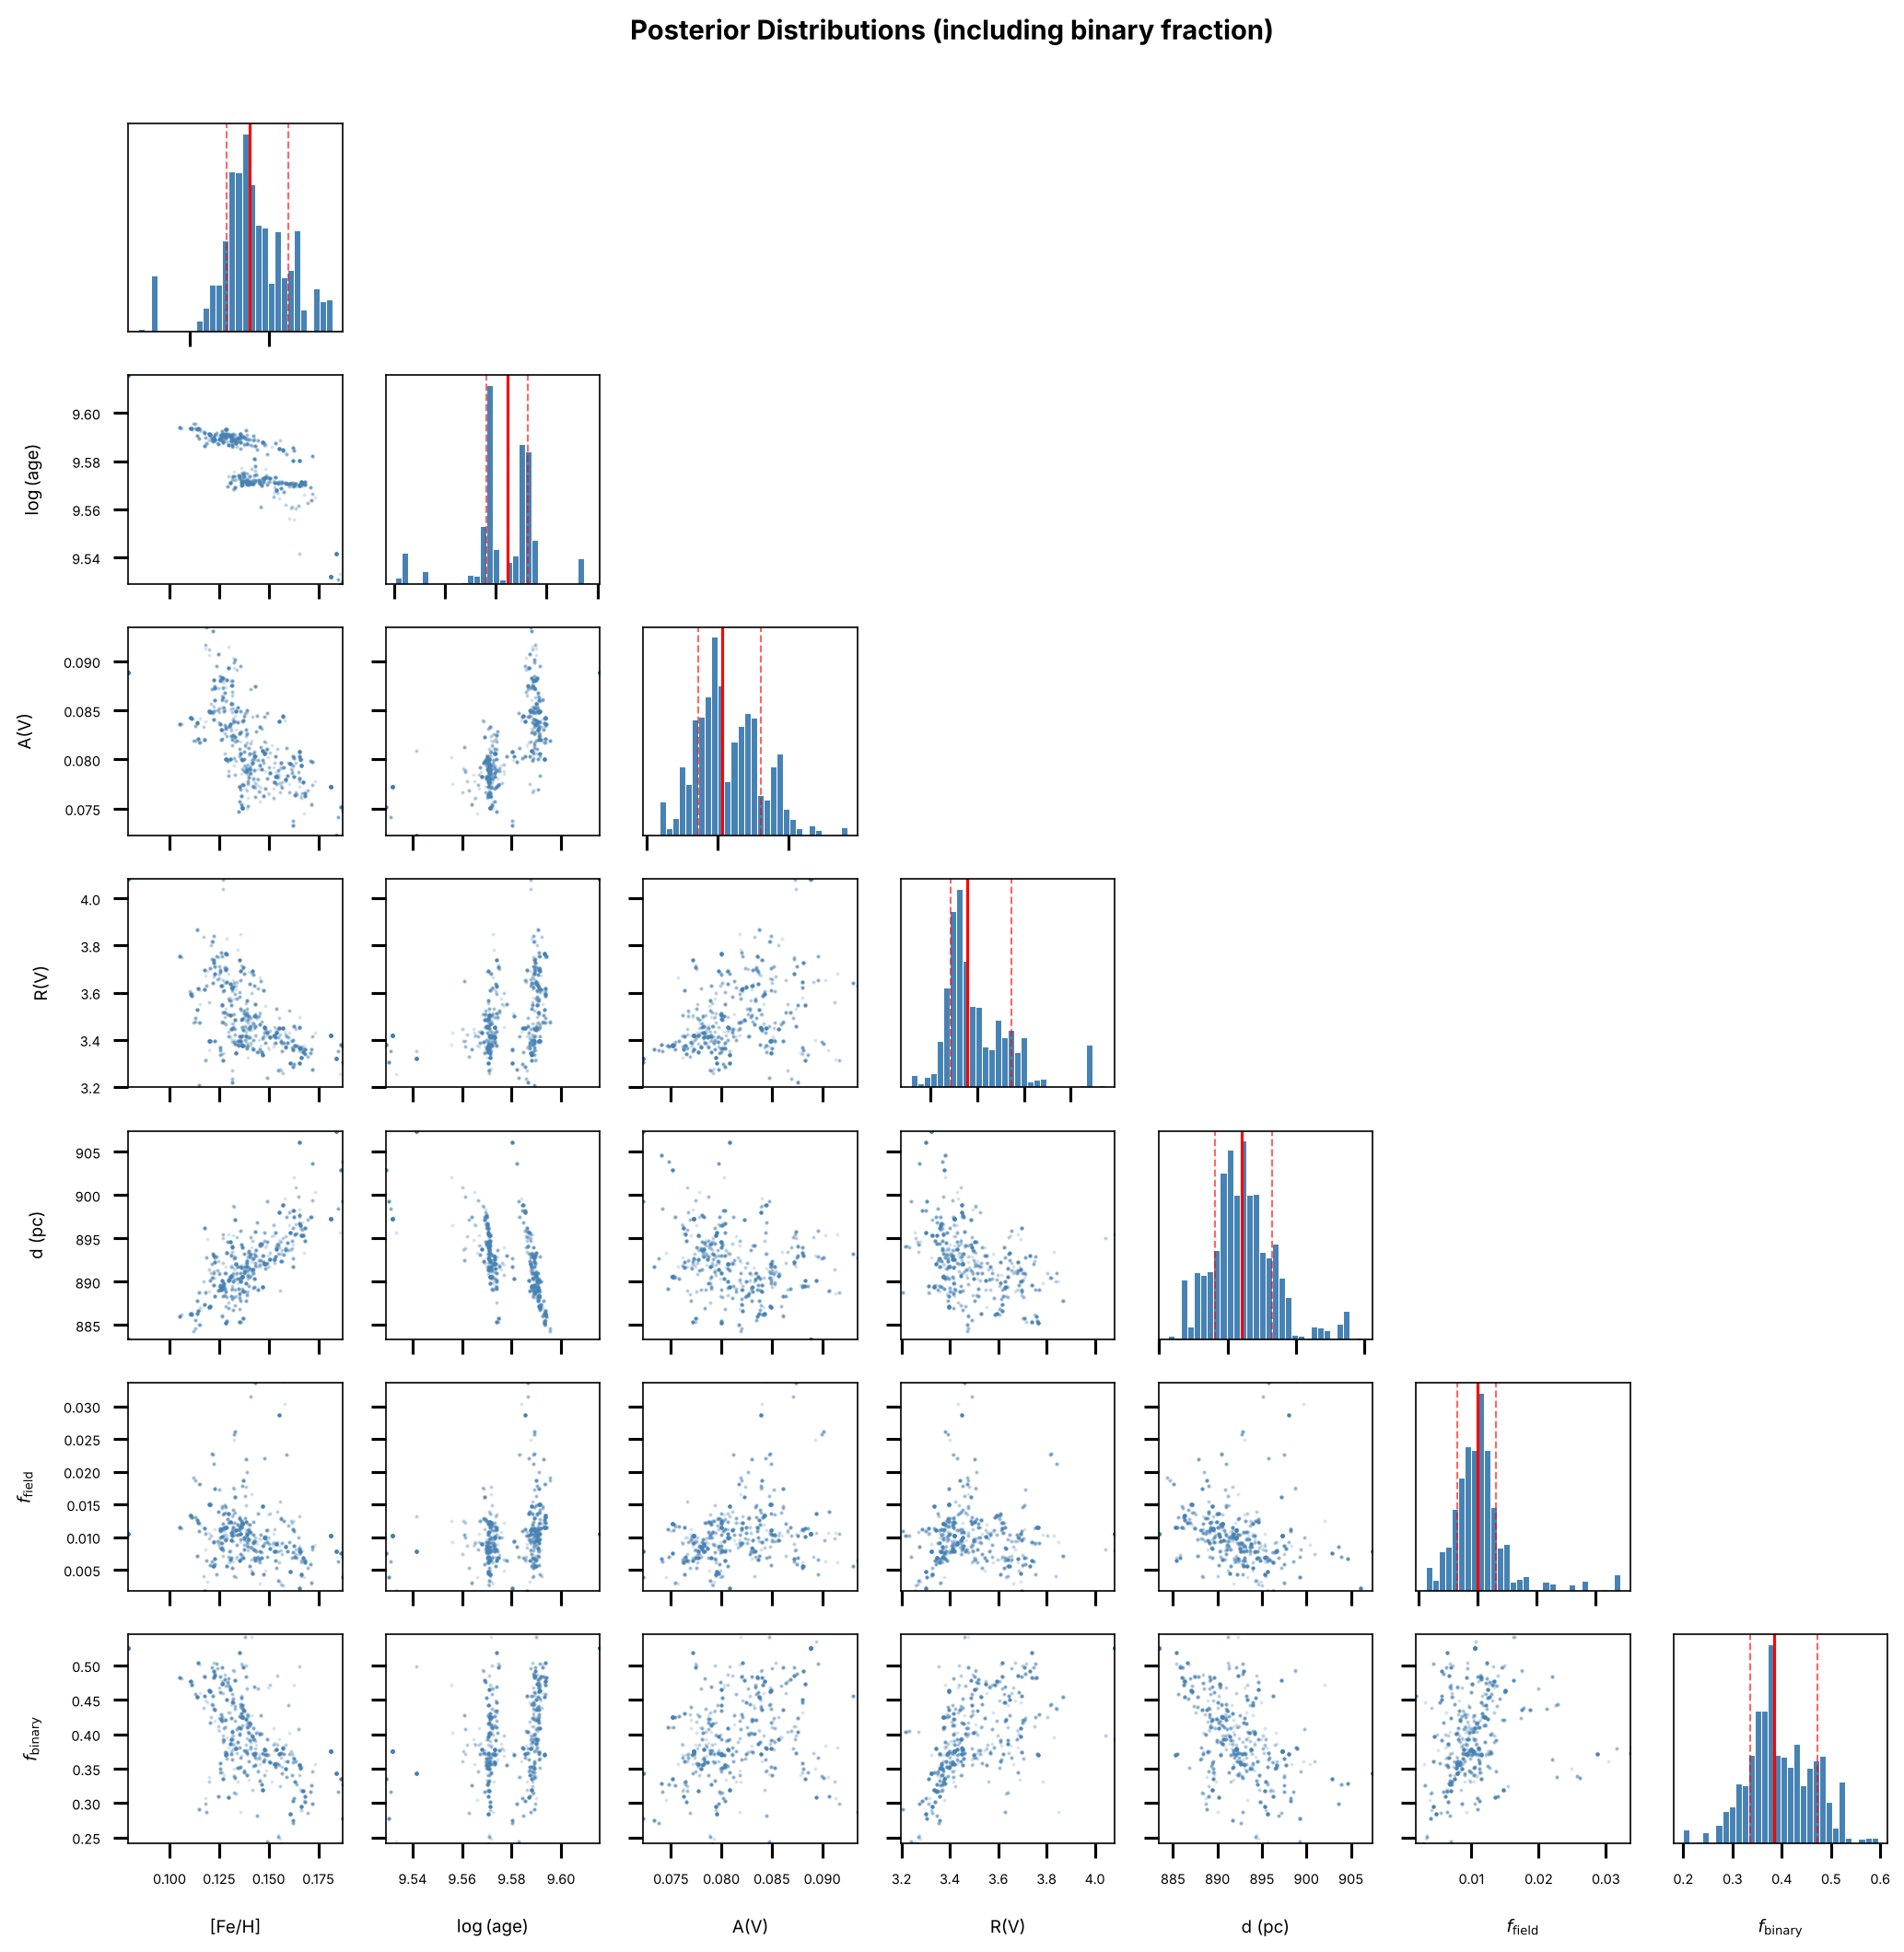
Posterior summary (median +/- 1-sigma):
-------------------------------------------------------
        [Fe/H] =   0.1377  +0.0246  -0.0149
      log(age) =   9.5808  +0.0101  -0.0106
          A(V) =   0.0806  +0.0055  -0.0034
          R(V) =   3.4477  +0.2343  -0.0894
      distance =    892.1  +4.4  -3.8
    field_frac =   0.0100  +0.0031  -0.0034
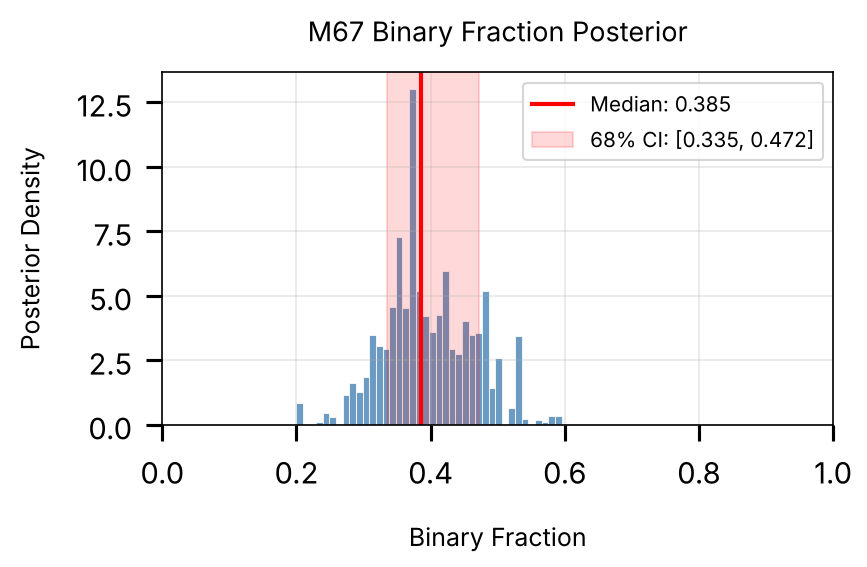
   binary_frac =   0.3850  +0.0866  -0.0495
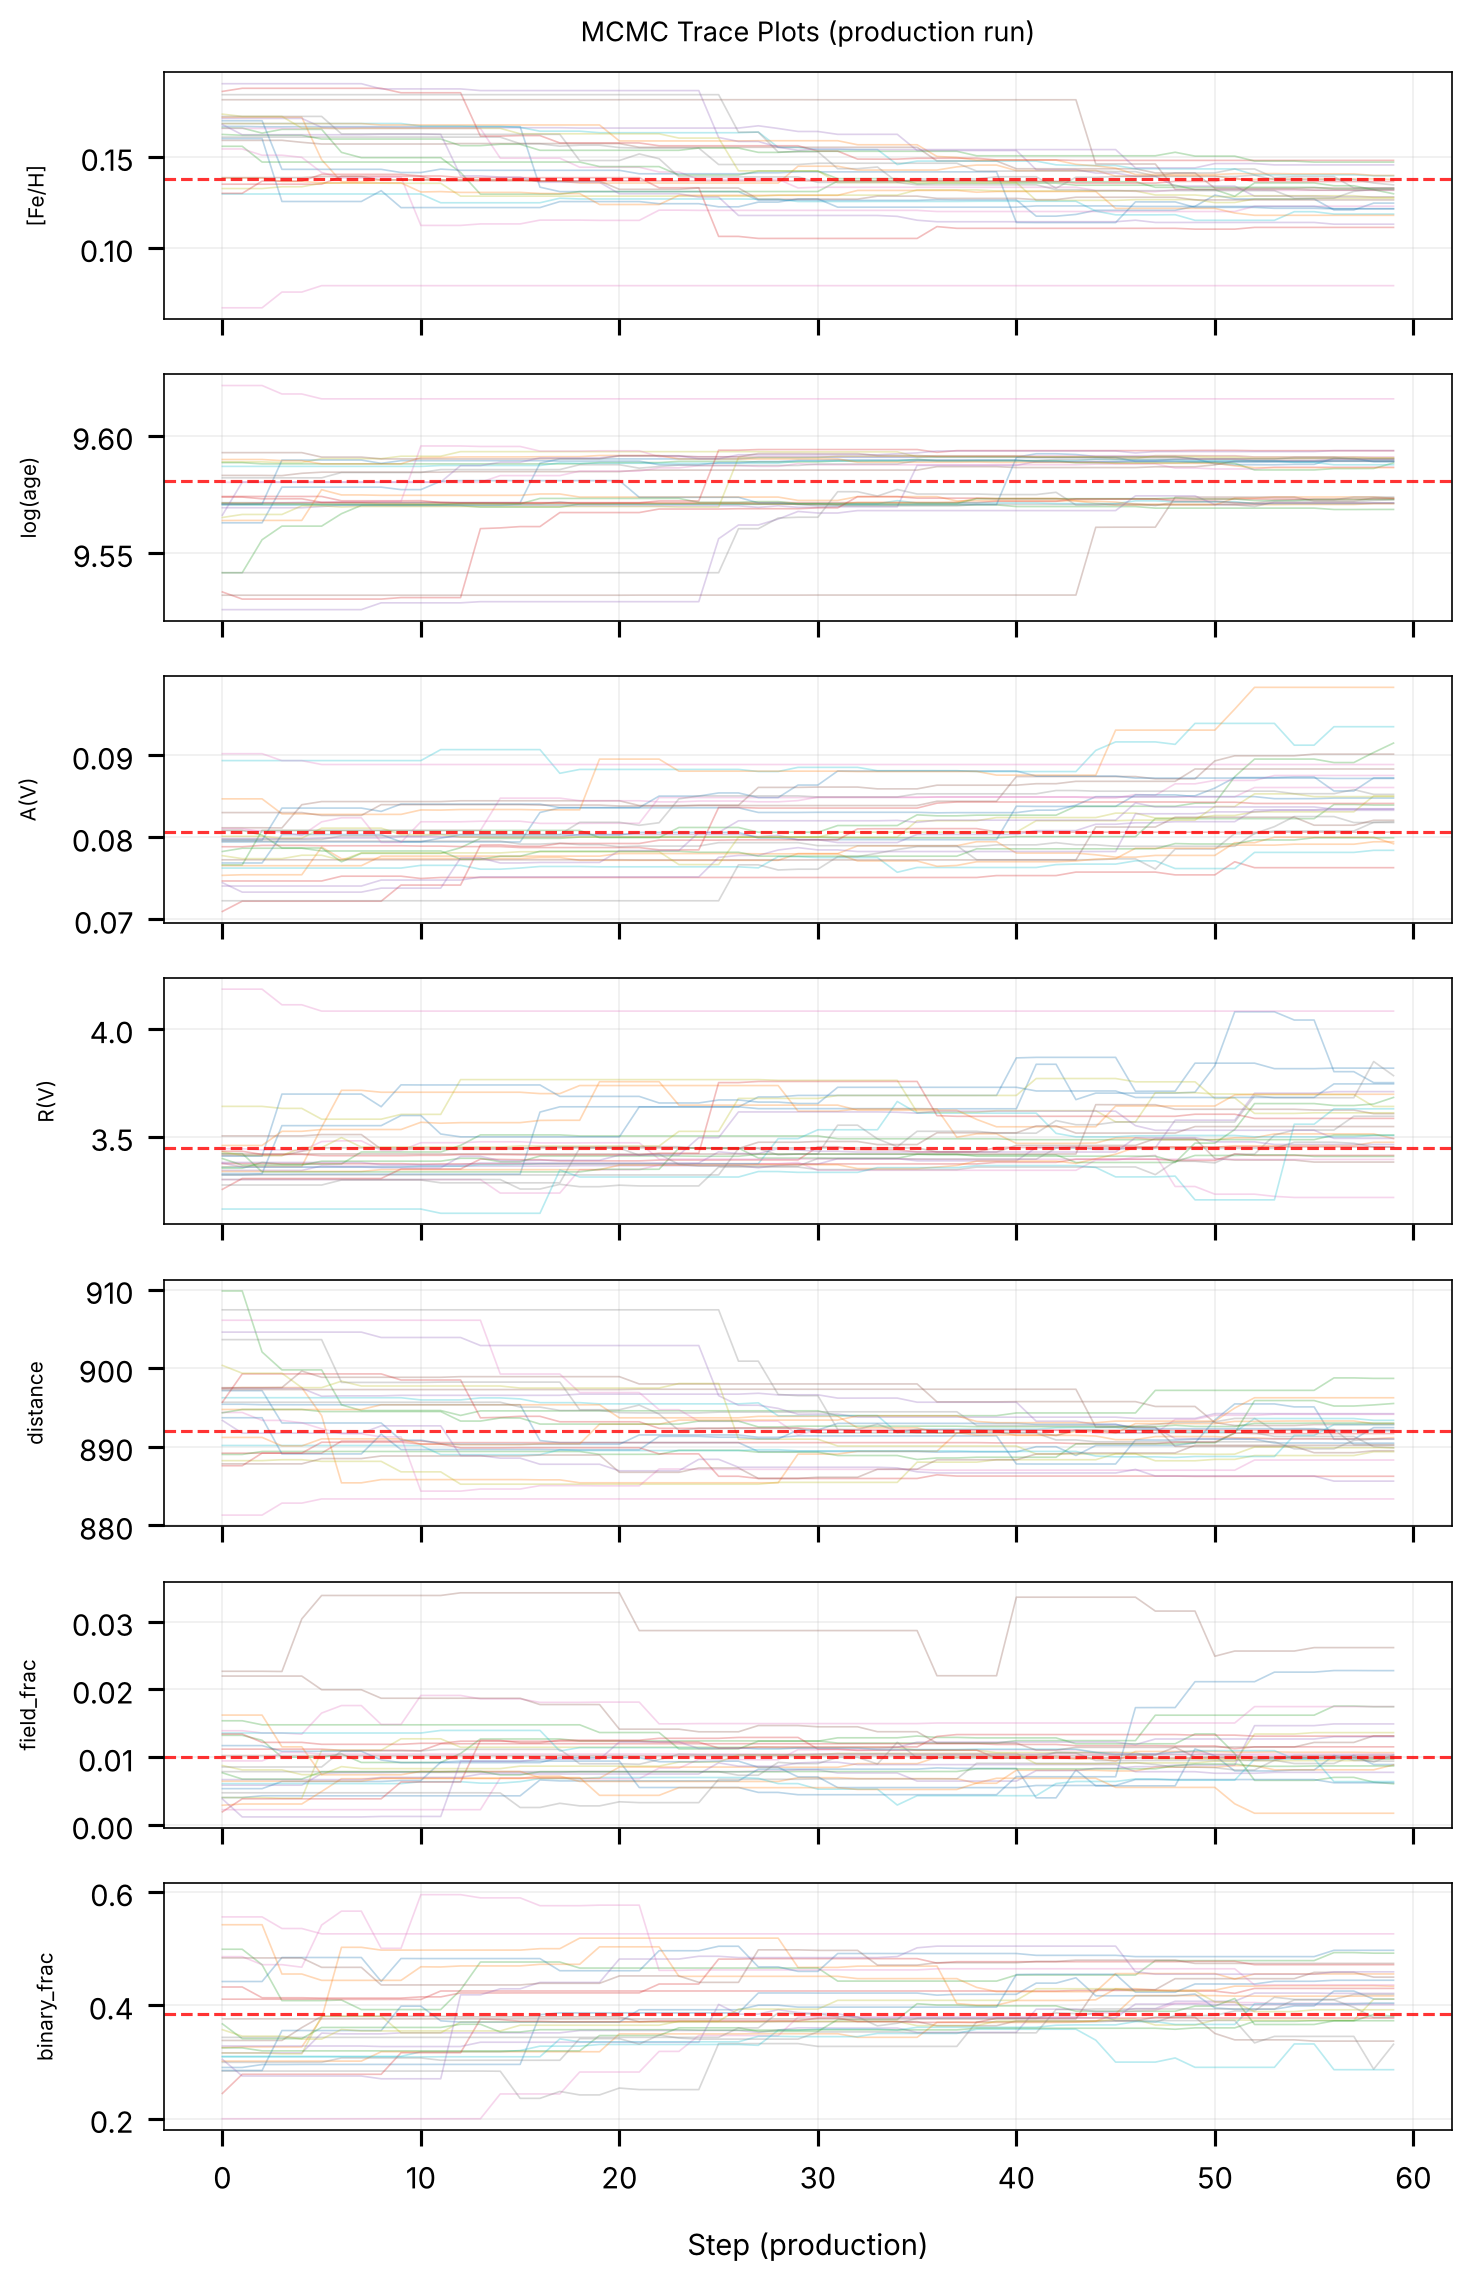
# Trace plots: visualize walker evolution
chain = sampler.get_chain()  # shape (nsteps, nwalkers, ndim)

fig, axes = plt.subplots(ndim, 1, figsize=(10, 2.2 * ndim), sharex=True)

for i in range(ndim):
    ax = axes[i]
    for w in range(nwalkers):
        ax.plot(chain[:, w, i], alpha=0.3, lw=0.8)
    ax.set_ylabel(param_names[i], fontsize=10)
    ax.grid(True, alpha=0.2)

    # Show median of final samples
    q50 = np.median(samples[:, i])
    ax.axhline(q50, color='red', ls='--', lw=1.5, alpha=0.8)

axes[-1].set_xlabel('Step (production)')
axes[0].set_title('MCMC Trace Plots (production run)', fontsize=13)
plt.tight_layout()
save_figure(fig, 'mcmc_traces')
plt.show()
# Corner plot: posterior distributions for all parameters
# We use a lightweight manual corner plot (no extra dependency needed).

fig, axes = plt.subplots(ndim, ndim, figsize=(14, 14))

# Compact labels for the axes
short_labels = ['[Fe/H]', r'$\log$(age)', 'A(V)', 'R(V)',
                'd (pc)', r'$f_{\rm field}$', r'$f_{\rm binary}$']

for i in range(ndim):
    for j in range(ndim):
        ax = axes[i, j]
        if j > i:
            ax.set_visible(False)
            continue

        if i == j:
            # Diagonal: 1D histogram
            ax.hist(samples[:, i], bins=30, color='steelblue',
                    edgecolor='white', lw=0.5, density=True)
            q16, q50, q84 = np.percentile(samples[:, i], [16, 50, 84])
            ax.axvline(q50, color='red', ls='-', lw=1.5)
            ax.axvline(q16, color='red', ls='--', lw=1, alpha=0.6)
            ax.axvline(q84, color='red', ls='--', lw=1, alpha=0.6)
            ax.set_yticks([])
        else:
            # Off-diagonal: 2D scatter
            ax.scatter(samples[:, j], samples[:, i], s=1, alpha=0.15,
                      color='steelblue', rasterized=True)
            ax.set_xlim(np.percentile(samples[:, j], [1, 99]))
            ax.set_ylim(np.percentile(samples[:, i], [1, 99]))

        # Labels
        if i == ndim - 1:
            ax.set_xlabel(short_labels[j], fontsize=9)
        else:
            ax.set_xticklabels([])
        if j == 0 and i > 0:
            ax.set_ylabel(short_labels[i], fontsize=9)
        elif j > 0:
            ax.set_yticklabels([])

        ax.tick_params(labelsize=7)

fig.suptitle('Posterior Distributions (including binary fraction)',
             fontsize=14, fontweight='bold', y=1.01)
plt.tight_layout()
save_figure(fig, 'corner_plot')
plt.show()

# Focused view: binary fraction posterior
fig, ax = plt.subplots(figsize=(6, 4))
ax.hist(samples[:, 6], bins=40, color='steelblue', edgecolor='white',
        lw=0.5, density=True, alpha=0.8)
bf_q16, bf_q50, bf_q84 = np.percentile(samples[:, 6], [16, 50, 84])
ax.axvline(bf_q50, color='red', ls='-', lw=2,
           label=f'Median: {bf_q50:.3f}')
ax.axvspan(bf_q16, bf_q84, color='red', alpha=0.15,
           label=f'68% CI: [{bf_q16:.3f}, {bf_q84:.3f}]')
ax.set_xlabel('Binary Fraction', fontsize=12)
ax.set_ylabel('Posterior Density', fontsize=12)
ax.set_title('M67 Binary Fraction Posterior', fontsize=13)
ax.legend(fontsize=10)
ax.set_xlim(0, 1)
ax.grid(True, alpha=0.3)
plt.tight_layout()
save_figure(fig, 'binary_fraction_posterior')
plt.show()
Summary and Key Takeaways
This tutorial has demonstrated cluster analysis with brutus, including joint inference of the binary fraction alongside standard cluster parameters.
Key Techniques
Isochrone Fitting
Use
isochrone_population_loglikefor cluster parameter inferenceSimultaneously fit age, metallicity, distance, and extinction
Incorporate parallax constraints from Gaia
Binary Fraction as a Free Parameter
The SMF (secondary mass fraction) grid in
generate_isochrone_population_gridencodes both single stars (SMF=0) and binaries (SMF>0)By re-weighting SMF jacobians, we control the relative probability of single vs. binary stars
MCMC sampling recovers the posterior on binary fraction alongside all other cluster parameters
MCMC Sampling
emceeprovides proper uncertainty quantification for all 7 parametersTrace plots verify convergence and mixing
Corner plots reveal parameter correlations (e.g., age-metallicity, distance-extinction)
M67 Results
Our fits broadly agree with literature values:
Age: ~3.5-4.0 Gyr (consistent with Sarajedini et al. 2009)
[Fe/H]: ~+0.1 to +0.15, above the near-solar value from spectroscopy
Distance: ~890 pc; the mean parallax of the members gives ~840 pc
E(B-V): ~0.02-0.05 (consistent with Schlegel maps)
Binary fraction: constrained by multiband photometry
Best Practices
Minimum bands: Require at least 4 valid photometric bands per star
Membership selection: Use proper motion and parallax to identify members
Burn-in: Discard initial MCMC steps to remove initialization bias
Convergence: Check trace plots and acceptance fractions
Production runs: Use more walkers and steps than shown here for publication-quality results
Next Steps
Tutorial 7: 3D Dust Mapping
Tutorial 8: Photometric Calibration
Try fitting other clusters (Pleiades, Hyades, NGC 6791)
Increase MCMC steps for tighter constraints on binary fraction