Tutorial 5: Fitting Individual Stars with BruteForce
brutus.analysis.BruteForce performs Bayesian parameter inference for individual stars over pre-computed model grids, optimizing distance and extinction at each grid point before integrating the Galactic, dust, and parallax priors.
Topics Covered
Data preparation (flux units, parallaxes, coordinates)
BruteForce class setup and configuration
Running fits with various options
Result visualization and interpretation
Prerequisites
The setup cell below checks the data files this tutorial needs; Tutorial 00 shows how to download them. The Orion field data ship in tutorials/.
# Optional: Download required data files (only needed if not already cached)
# Uncomment the lines below to download them.

# from brutus.data import fetch_grids, fetch_offsets, fetch_dustmaps
# fetch_grids()
# fetch_offsets()
# fetch_dustmaps()  # optional
# Imports and setup
import numpy as np
import matplotlib.pyplot as plt
import warnings
warnings.filterwarnings('ignore')

from tutorial_utils import (
    setup_tutorial,
    print_saved_files,
    record_file,
    TUTORIALS_DIR,
    find_brutus_data_file,
    save_figure as _save_fig,
    print_section,
    load_orion_data,
)

info = setup_tutorial(5, title="Tutorial 05: Fitting Individual Stars with BruteForce")


def save_figure(fig, name):
    """Save figure to this tutorial's plot directory."""
    _save_fig(fig, 5, name)
1. Data Preparation for BruteForce
BruteForce requires specific data formats:
Photometry in flux units (maggies = 10^(-0.4 * magnitude))
Parallaxes in mas (milliarcseconds) from Gaia
Galactic coordinates (l, b) for applying priors
Let’s load and examine the Orion field data.
from brutus.utils import inv_magnitude, magnitude

# Load example Orion field data
data = load_orion_data()

print(f"Loaded {len(data['phot'])} sources")
print(f"  Photometry shape: {data['phot'].shape}")
print(f"  Filters: Pan-STARRS (grizy) + 2MASS (JHKs) = 8 bands")
print(f"  Valid parallaxes: {np.sum(np.isfinite(data['parallax']))}")
print(f"  Coordinate range: l=[{data['coords'][:, 0].min():.1f}, {data['coords'][:, 0].max():.1f}], "
      f"b=[{data['coords'][:, 1].min():.1f}, {data['coords'][:, 1].max():.1f}] deg")
Loaded 207 sources
  Photometry shape: (207, 8)
  Filters: Pan-STARRS (grizy) + 2MASS (JHKs) = 8 bands
  Valid parallaxes: 199
  Coordinate range: l=[208.9, 209.3], b=[-20.1, -19.7] deg
# Add systematic photometric uncertainties in quadrature
# The MIST isochrone corrections have systematic uncertainties of ~0.02 mag
# in the optical and ~0.03 mag in the NIR (Speagle et al. 2025, Table 5).
# These should be added to the measurement errors before fitting.

# Systematic uncertainties per band (mag)
sys_err_mag = np.array([0.02, 0.02, 0.02, 0.02, 0.02,   # PS grizy
                        0.03, 0.03, 0.03])                # 2MASS JHKs

# Convert to flux space and add in quadrature
sys_err_flux = data['phot'] * sys_err_mag[np.newaxis, :] * np.log(10) / 2.5
data['err'] = np.sqrt(data['err']**2 + sys_err_flux**2)

# Show the effect
mag_err_after = 2.5 / np.log(10) * data['err'] / np.where(data['phot'] > 0, data['phot'], 1)
filt_names = ['PS_g', 'PS_r', 'PS_i', 'PS_z', 'PS_y', '2MASS_J', '2MASS_H', '2MASS_Ks']
print("Effective magnitude errors after adding systematics:")
for i, name in enumerate(filt_names):
    valid = data['mask'][:, i]
    if np.sum(valid) > 0:
        print(f"  {name:>10s}: min={np.min(mag_err_after[valid, i]):.4f}, "
              f"median={np.median(mag_err_after[valid, i]):.4f} mag")
Effective magnitude errors after adding systematics:
        PS_g: min=0.0288, median=0.0425 mag
        PS_r: min=0.0286, median=0.0306 mag
        PS_i: min=0.0285, median=0.0288 mag
        PS_z: min=0.0285, median=0.0289 mag
        PS_y: min=0.0286, median=0.0295 mag
     2MASS_J: min=0.0366, median=0.0439 mag
     2MASS_H: min=0.0372, median=0.0461 mag
    2MASS_Ks: min=0.0350, median=0.0431 mag
2. BruteForce Class Setup
BruteForce performs fast stellar parameter inference by:
Evaluating likelihood over a pre-computed grid of stellar models
Marginalizing analytically over nuisance parameters (distance, extinction)
Incorporating priors (Galactic structure, 3D dust, parallax)
Let’s load the MIST model grid and initialize BruteForce.
from brutus.analysis import BruteForce
from brutus.core import StarGrid
from brutus.data import load_models, filters

# Load MIST model grid
grid_file = find_brutus_data_file('grid_mist_v9.h5')

# Define filters (Pan-STARRS + 2MASS)
filt = filters.ps[:-2] + filters.tmass  # Skip PS w and open bands

# Load models
models, labels, label_mask = load_models(grid_file, filters=filt, verbose=False)

print(f"Loaded {len(models):,} models ({len(filt)} bands)")
print(f"  Model shape: {models.shape}")
print(f"  Parameter fields: {list(labels.dtype.names)}")
print(f"  Key parameters:")
print(f"    Mass range: [{labels['mini'].min():.2f}, {labels['mini'].max():.1f}] M_sun")
print(f"    [Fe/H] range: [{labels['feh'].min():.2f}, {labels['feh'].max():.2f}]")
print(f"    log(age) range: [{labels['loga'].min():.2f}, {labels['loga'].max():.2f}]")

# Create StarGrid and initialize BruteForce
grid = StarGrid(models, labels, verbose=False)
bf = BruteForce(grid, verbose=False)
Loaded 613,530 models (8 bands)
  Model shape: (613530, 8, 3)
  Parameter fields: ['mini', 'feh', 'eep', 'smf', 'afe', 'loga', 'logl', 'logt', 'logg', 'agewt']
  Key parameters:
    Mass range: [0.50, 2.0] M_sun
    [Fe/H] range: [-3.00, 0.45]
    log(age) range: [6.46, 10.14]
3. Running BruteForce Fits
Now let’s fit all sources from the Orion field, demonstrating various fitting options.
Key considerations:
Photometric offsets calibrate models to match observed photometry
3D dust maps provide extinction priors
Parallax constraints from Gaia improve distance estimates
Galactic priors based on position help constrain parameters
# Load photometric offsets (calibration corrections)
from brutus.data import load_offsets

try:
    offsets_file = find_brutus_data_file('offsets_mist_v9.txt')
    offsets_mist = load_offsets(offsets_file, filters=filt, verbose=False)
    print("Photometric offsets (multiplicative flux):")
    for band, offset in zip(filt, offsets_mist):
        print(f"  {band}: {offset:.4f}")
except FileNotFoundError:
    offsets_mist = np.ones(len(filt))
    print("  Offsets file not found, using unity offsets")

# Select sources with sufficient photometric coverage
good_sources = np.sum(data['mask'], axis=1) >= 4  # At least 4 bands
idx_fit = np.where(good_sources)[0]

print(f"\nSelected {len(idx_fit)} sources for fitting")
print(f"  Criteria: >=4 bands detected")
print(f"  Average bands per source: {np.mean(np.sum(data['mask'][idx_fit], axis=1)):.1f}")

# Try to load 3D dust map
try:
    dustfile = find_brutus_data_file('bayestar2019_v1.h5')
    print("\n3D dust map (Bayestar) available")
except FileNotFoundError:
    dustfile = None
    print("\n3D dust map not available (will use flat prior)")
Photometric offsets (multiplicative flux):
  PS_g: 1.0000
  PS_r: 0.9500
  PS_i: 0.9600
  PS_z: 0.9400
  PS_y: 0.9500
  2MASS_J: 0.9800
  2MASS_H: 1.0400
  2MASS_Ks: 1.0300

Selected 207 sources for fitting (>=4 bands detected; mean 7.4 bands/source)
3D dust map (Bayestar) available
Note: brutus recommends at least 4 photometric bands for reliable fits. Users can disable the 3D dust map prior (making it flat over A(V)) by not passing the
dustfileargument tobf.fit().
# Run BruteForce fits
# Save results to tutorials/ directory for use by later tutorials
output_file = TUTORIALS_DIR / 'Orion_l209.1_b-19.9_mist.h5'

import time

print(f"Running BruteForce fits on {len(idx_fit)} sources...")
print("This may take several minutes depending on your hardware.")

t0 = time.time()

bf.fit(
    data=data['phot'][idx_fit],
    data_err=data['err'][idx_fit],
    data_mask=data['mask'][idx_fit],
    data_labels=idx_fit,
    save_file=str(output_file),
    data_coords=data['coords'][idx_fit],
    parallax=data['parallax'][idx_fit],
    parallax_err=data['parallax_err'][idx_fit],
    phot_offsets=offsets_mist,
    dustfile=dustfile,
    Ndraws=500,
    Nmc_prior=20,
    logl_dim_prior=True,
    save_dar_draws=True,
    running_io=False,
    verbose=False
)

elapsed = time.time() - t0
print(f"\nFitting complete in {elapsed:.1f} seconds ({elapsed/60:.1f} minutes).")
record_file(output_file)
print(f"Results saved to {output_file.name}")
Running BruteForce fits on 207 sources...
Fitting complete in 168.1 seconds (2.8 minutes).
Results saved to Orion_l209.1_b-19.9_mist.h5
# Load and analyze results
import h5py

with h5py.File(output_file, 'r') as f:
    chi2 = f['obj_chi2min'][:]
    nbands = f['obj_Nbands'][:]
    model_idx = f['model_idx'][:]
    ml_scale = f['ml_scale'][:]
    ml_av = f['ml_av'][:]
    ml_rv = f['ml_rv'][:]
    log_post = f['obj_log_post'][:]
    dists = f['samps_dist'][:]
    reds = f['samps_red'][:]
    dreds = f['samps_dred'][:]

print("Loaded fitting results:")
print(f"  chi2 values: {chi2.shape}")
print(f"  Model indices: {model_idx.shape}")
print(f"  ML scale/AV/RV: {ml_scale.shape}")
print(f"  Distance samples: {dists.shape}")

# Compute summary statistics
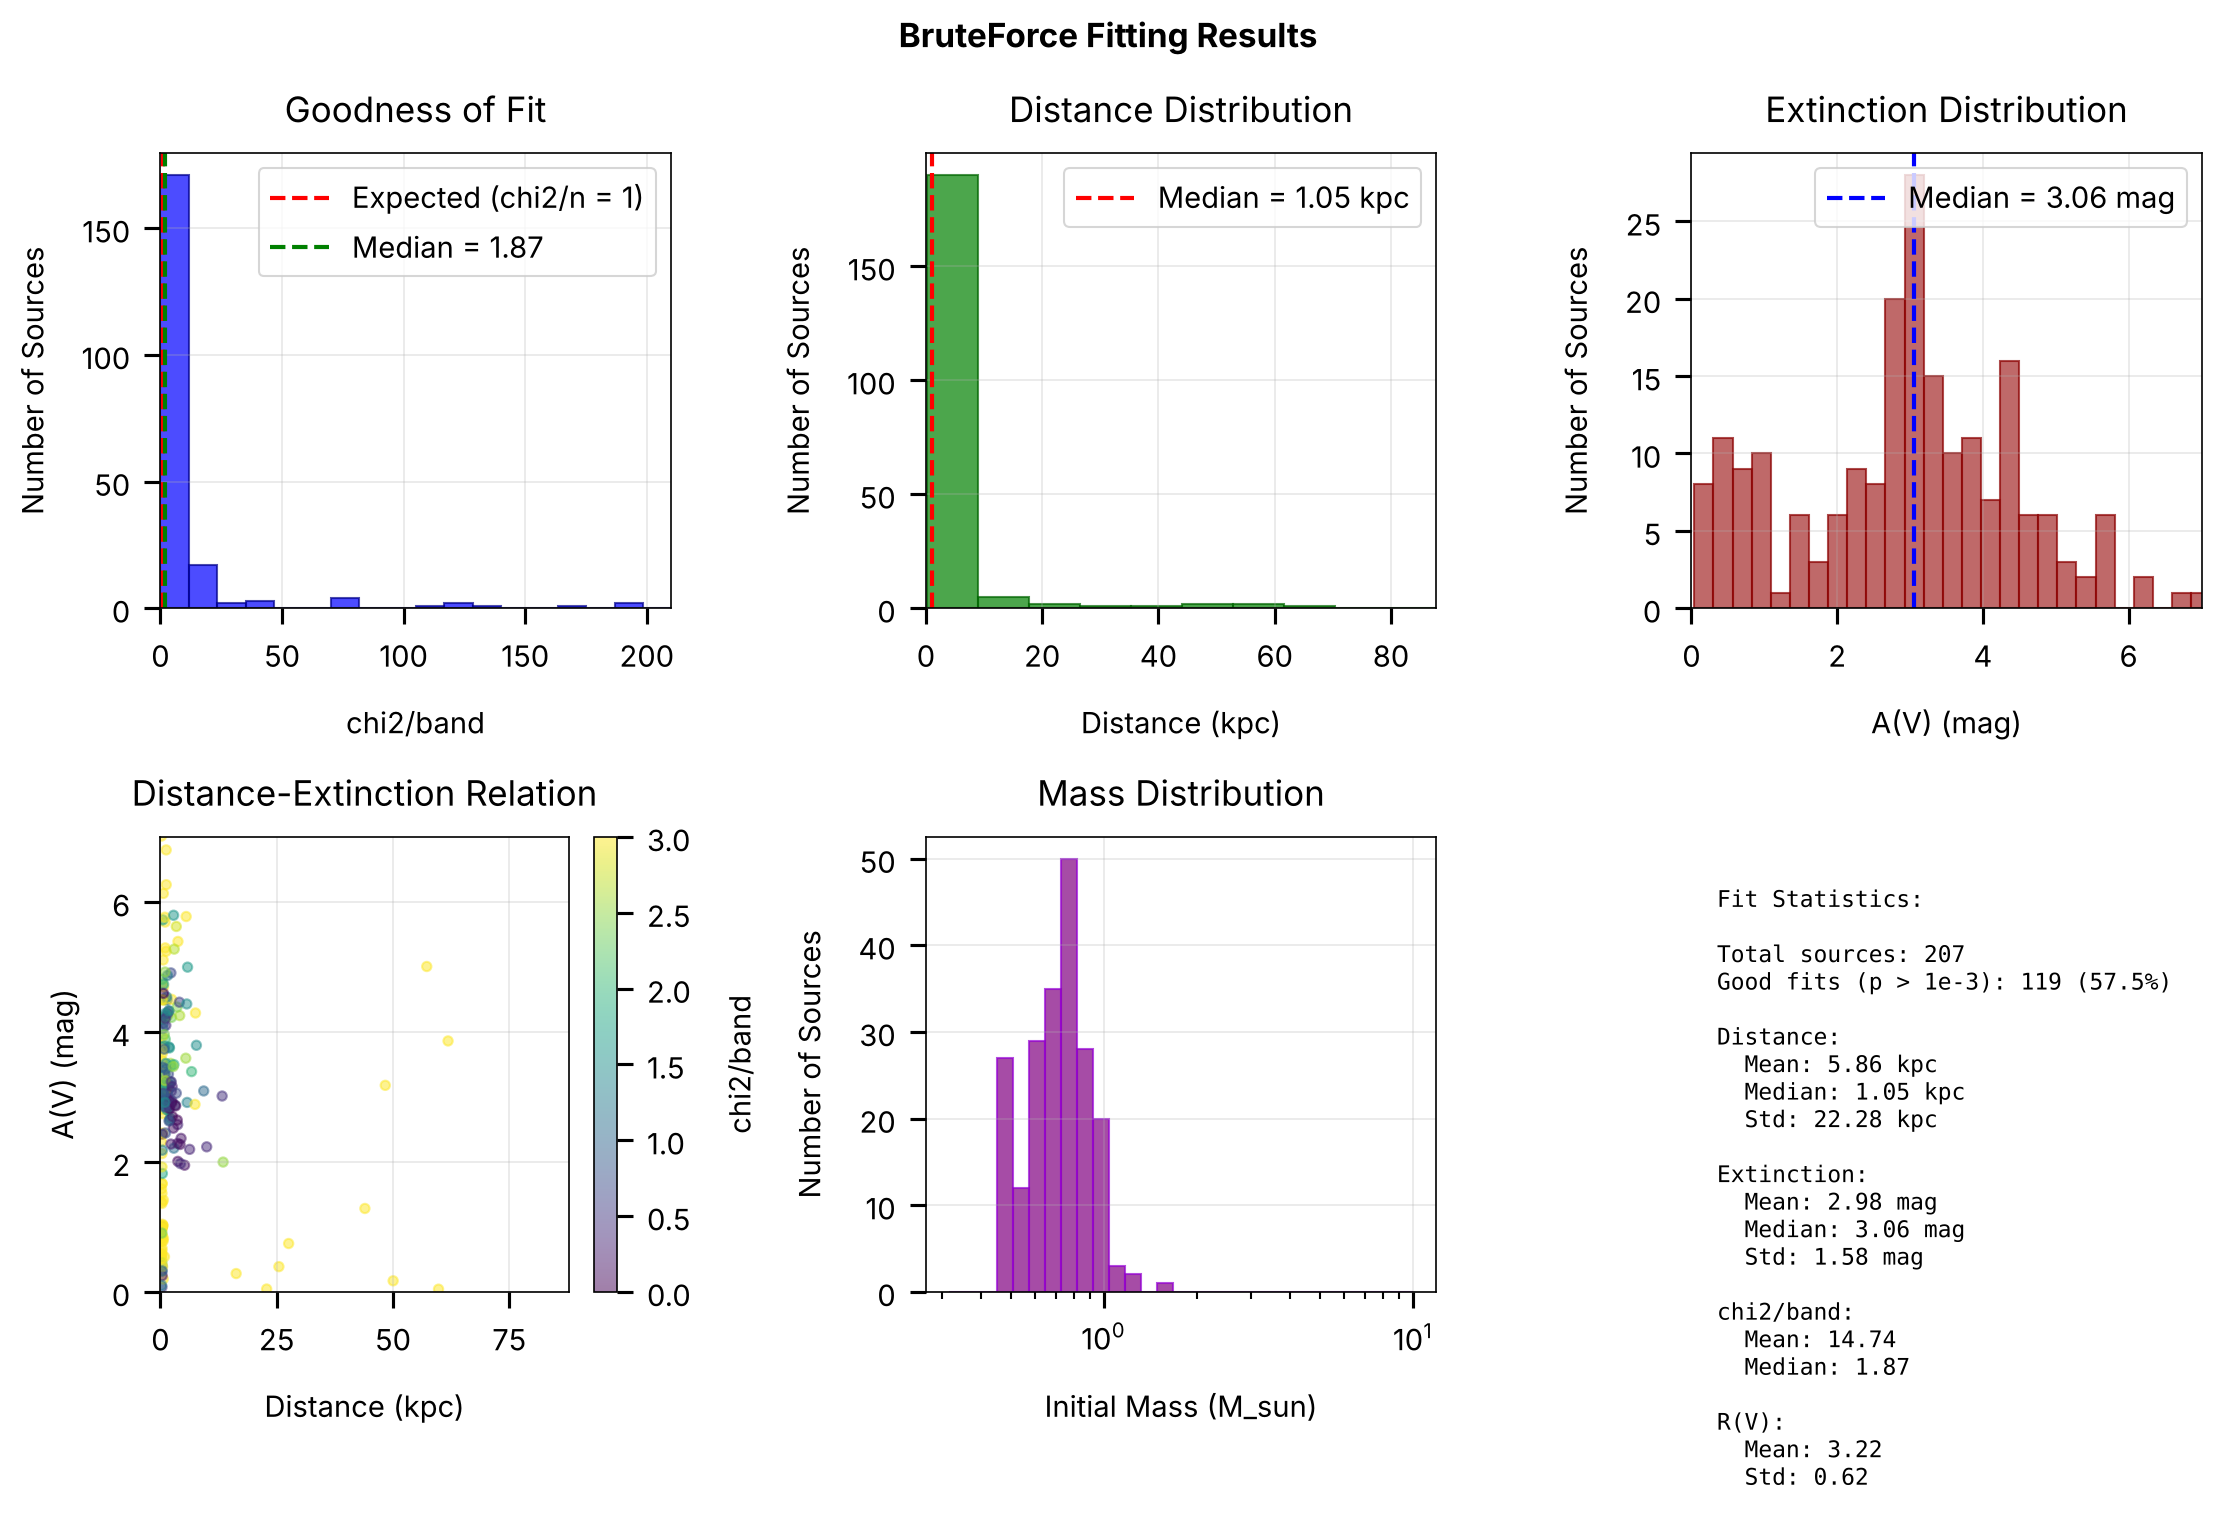
chi2_per_band = chi2 / nbands  # shown below as a diagnostic only
# Assess fit quality using the chi-square survival p-value with
# dof = Nbands - 3 (for scale, A_V, R_V), which provides a uniform
# false-positive rate across varying band counts.
from scipy.stats import chi2 as chi2_dist
dof = np.maximum(nbands - 3, 1)
pvals = chi2_dist.sf(chi2, dof)
mean_dists = np.mean(dists, axis=1)
mean_av = np.mean(reds, axis=1)

# Create fit quality visualization
fig, axes = plt.subplots(2, 3, figsize=(15, 10))

# Panel 1: Chi2 distribution
ax = axes[0, 0]
ax.hist(chi2_per_band, bins=30, alpha=0.7, color='blue', edgecolor='darkblue')
ax.axvline(1.0, color='red', ls='--', lw=2, label='Expected (chi2/n = 1)')
ax.axvline(np.median(chi2_per_band), color='green', ls='--', lw=2, label=f'Median = {np.median(chi2_per_band):.2f}')
ax.set_xlabel('chi2/band')
ax.set_ylabel('Number of Sources')
ax.set_title('Goodness of Fit')
ax.set_xlim(0, np.percentile(chi2_per_band, 99))
ax.legend()
ax.grid(True, alpha=0.3)

# Panel 2: Distance distribution
ax = axes[0, 1]
ax.hist(mean_dists, bins=30, alpha=0.7, color='green', edgecolor='darkgreen')
ax.axvline(np.median(mean_dists), color='red', ls='--', lw=2, label=f'Median = {np.median(mean_dists):.2f} kpc')
ax.set_xlabel('Distance (kpc)')
ax.set_ylabel('Number of Sources')
ax.set_title('Distance Distribution')
ax.set_xlim(0, np.percentile(mean_dists, 99))
ax.legend()
ax.grid(True, alpha=0.3)

# Panel 3: Extinction distribution
ax = axes[0, 2]
ax.hist(mean_av, bins=30, alpha=0.7, color='brown', edgecolor='darkred')
ax.axvline(np.median(mean_av), color='blue', ls='--', lw=2, label=f'Median = {np.median(mean_av):.2f} mag')
ax.set_xlabel('A(V) (mag)')
ax.set_ylabel('Number of Sources')
ax.set_title('Extinction Distribution')
ax.set_xlim(0, np.percentile(mean_av, 99))
ax.legend()
ax.grid(True, alpha=0.3)

# Panel 4: Distance vs extinction
ax = axes[1, 0]
scatter = ax.scatter(mean_dists, mean_av, alpha=0.5, s=20,
                    c=chi2_per_band, cmap='viridis', vmin=0, vmax=3)
ax.set_xlabel('Distance (kpc)')
ax.set_ylabel('A(V) (mag)')
ax.set_title('Distance-Extinction Relation')
ax.set_xlim(0, np.percentile(mean_dists, 99))
ax.set_ylim(0, np.percentile(mean_av, 99))
plt.colorbar(scatter, ax=ax, label='chi2/band')
ax.grid(True, alpha=0.3)

# Panel 5: Stellar parameters (using best-fit model per source)
ax = axes[1, 1]

best_draw = np.argmax(log_post, axis=1)
best_model_per_source = model_idx[np.arange(len(chi2)), best_draw]
unique_masses = []
for idx in best_model_per_source:
    if idx < len(labels):
        unique_masses.append(labels[idx]['mini'])

if unique_masses:
    ax.hist(unique_masses, bins=np.logspace(-0.5, 1, 30),
           alpha=0.7, color='purple', edgecolor='darkviolet')
    ax.set_xlabel('Initial Mass (M_sun)')
    ax.set_ylabel('Number of Sources')
    ax.set_title('Mass Distribution')
    ax.set_xscale('log')
    ax.grid(True, alpha=0.3)

# Panel 6: Fit statistics
ax = axes[1, 2]
ax.axis('off')

# Calculate statistics
good_fits = pvals > 1e-3
stats_text = f"""
Fit Statistics:

Total sources: {len(chi2)}
Good fits (p > 1e-3): {good_fits.sum()} ({100*good_fits.sum()/len(chi2):.1f}%)

Distance:
  Mean: {np.mean(mean_dists):.2f} kpc
  Median: {np.median(mean_dists):.2f} kpc
  Std: {np.std(mean_dists):.2f} kpc

Extinction:
  Mean: {np.mean(mean_av):.2f} mag
  Median: {np.median(mean_av):.2f} mag
  Std: {np.std(mean_av):.2f} mag

chi2/band:
  Mean: {np.mean(chi2_per_band):.2f}
  Median: {np.median(chi2_per_band):.2f}

R(V):
  Mean: {np.mean(dreds):.2f}
  Std: {np.std(dreds):.2f}
"""

ax.text(0.05, 0.95, stats_text, transform=ax.transAxes,
       fontsize=11, va='top', family='monospace')

plt.suptitle('BruteForce Fitting Results', fontsize=16, fontweight='bold')
save_figure(fig, 'fitting_results')
plt.show()
Loaded fitting results:
  chi2 values: (207,)
  Model indices: (207, 500)
  ML scale/AV/RV: (207, 500)
  Distance samples: (207, 500)
4. Visualizing Individual Results
Let’s examine individual star fits in detail to understand the posterior distributions and parameter correlations.
# Select a typical example star that passes the goodness-of-fit p-value cut
good_fit = pvals > 1e-3  # p-value threshold for a good fit

# Use the first source that passes the p-value cut
if good_fit[0]:
    star_idx = 0
else:
    star_idx = np.where(good_fit)[0][0]

data_idx = idx_fit[star_idx]

print(f"Selected example star (index {star_idx}):")
print(f"  p-value = {pvals[star_idx]:.3g}")
print(f"  N_bands = {nbands[star_idx]}")
if np.isfinite(data['parallax'][data_idx]):
    plx_snr = data['parallax'][data_idx] / data['parallax_err'][data_idx]
    print(f"  Parallax = {data['parallax'][data_idx]:.3f} +/- {data['parallax_err'][data_idx]:.3f} mas (SNR = {plx_snr:.1f})")
else:
    print(f"  Parallax = not available")
print(f"  Distance = {mean_dists[star_idx]:.2f} +/- {np.std(dists[star_idx]):.3f} kpc")
print(f"  A(V) = {mean_av[star_idx]:.2f} mag")
Selected example star (index 0):
  p-value = 0.763
  N_bands = 9
  Parallax = 3.495 +/- 0.048 mas (SNR = 72.9)
  Distance = 0.29 +/- 0.004 kpc
  A(V) = 0.32 mag
4.1 Visualizing a Single Star
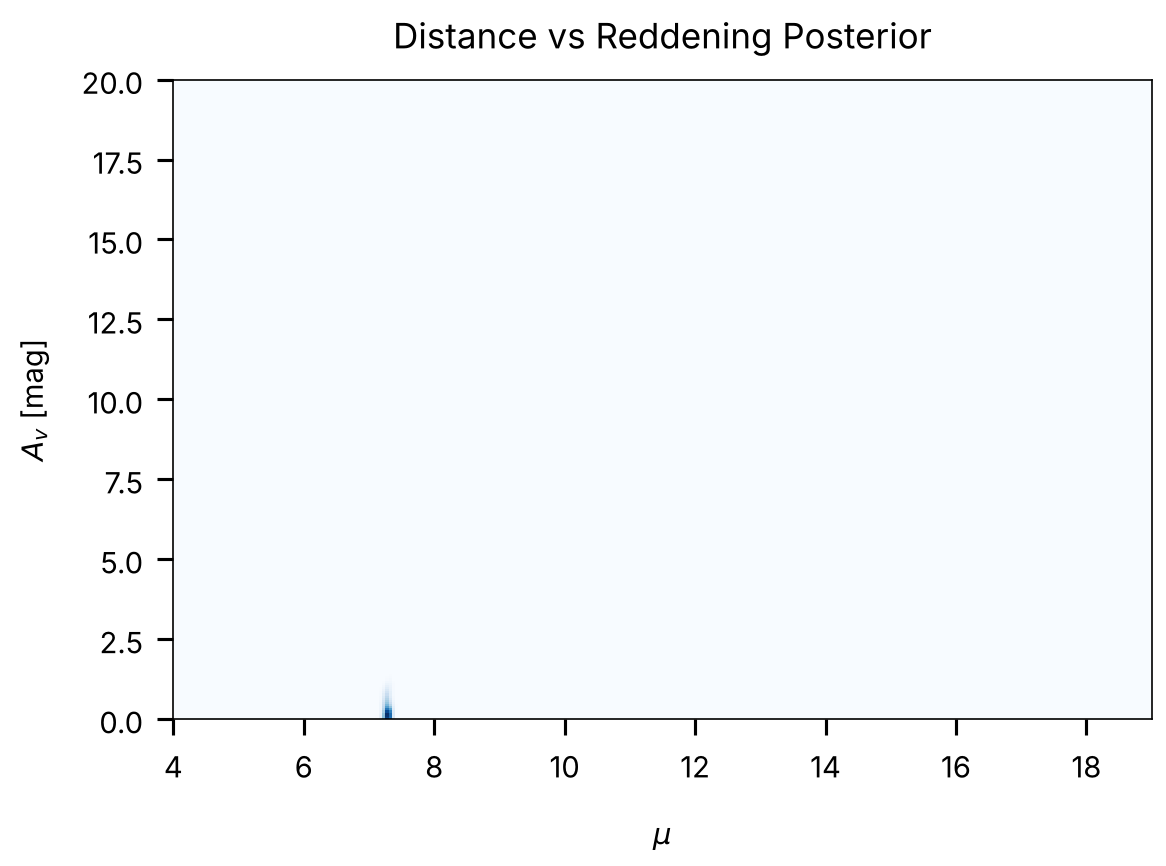
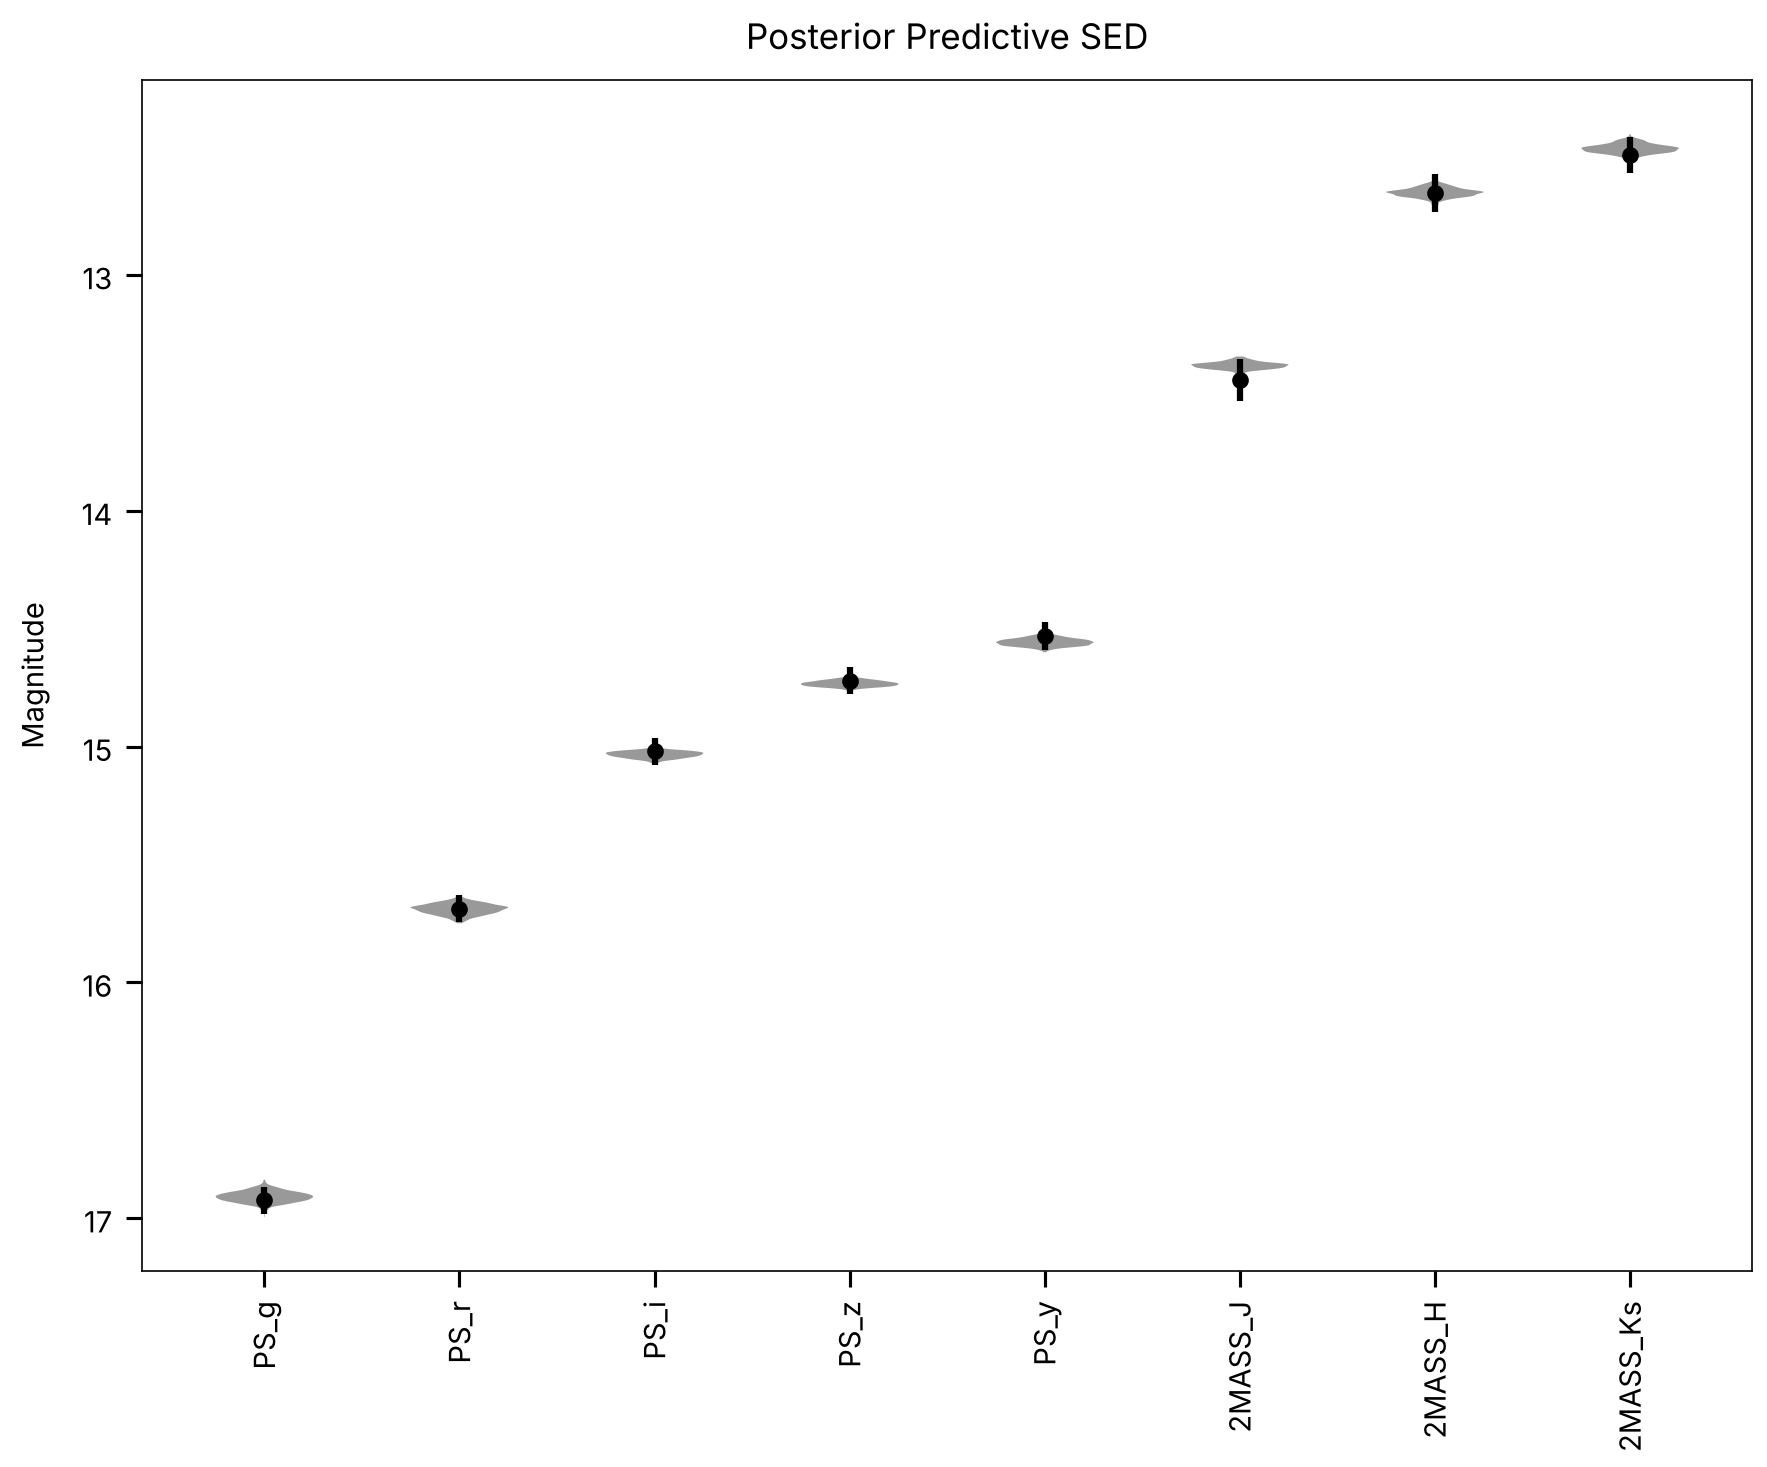
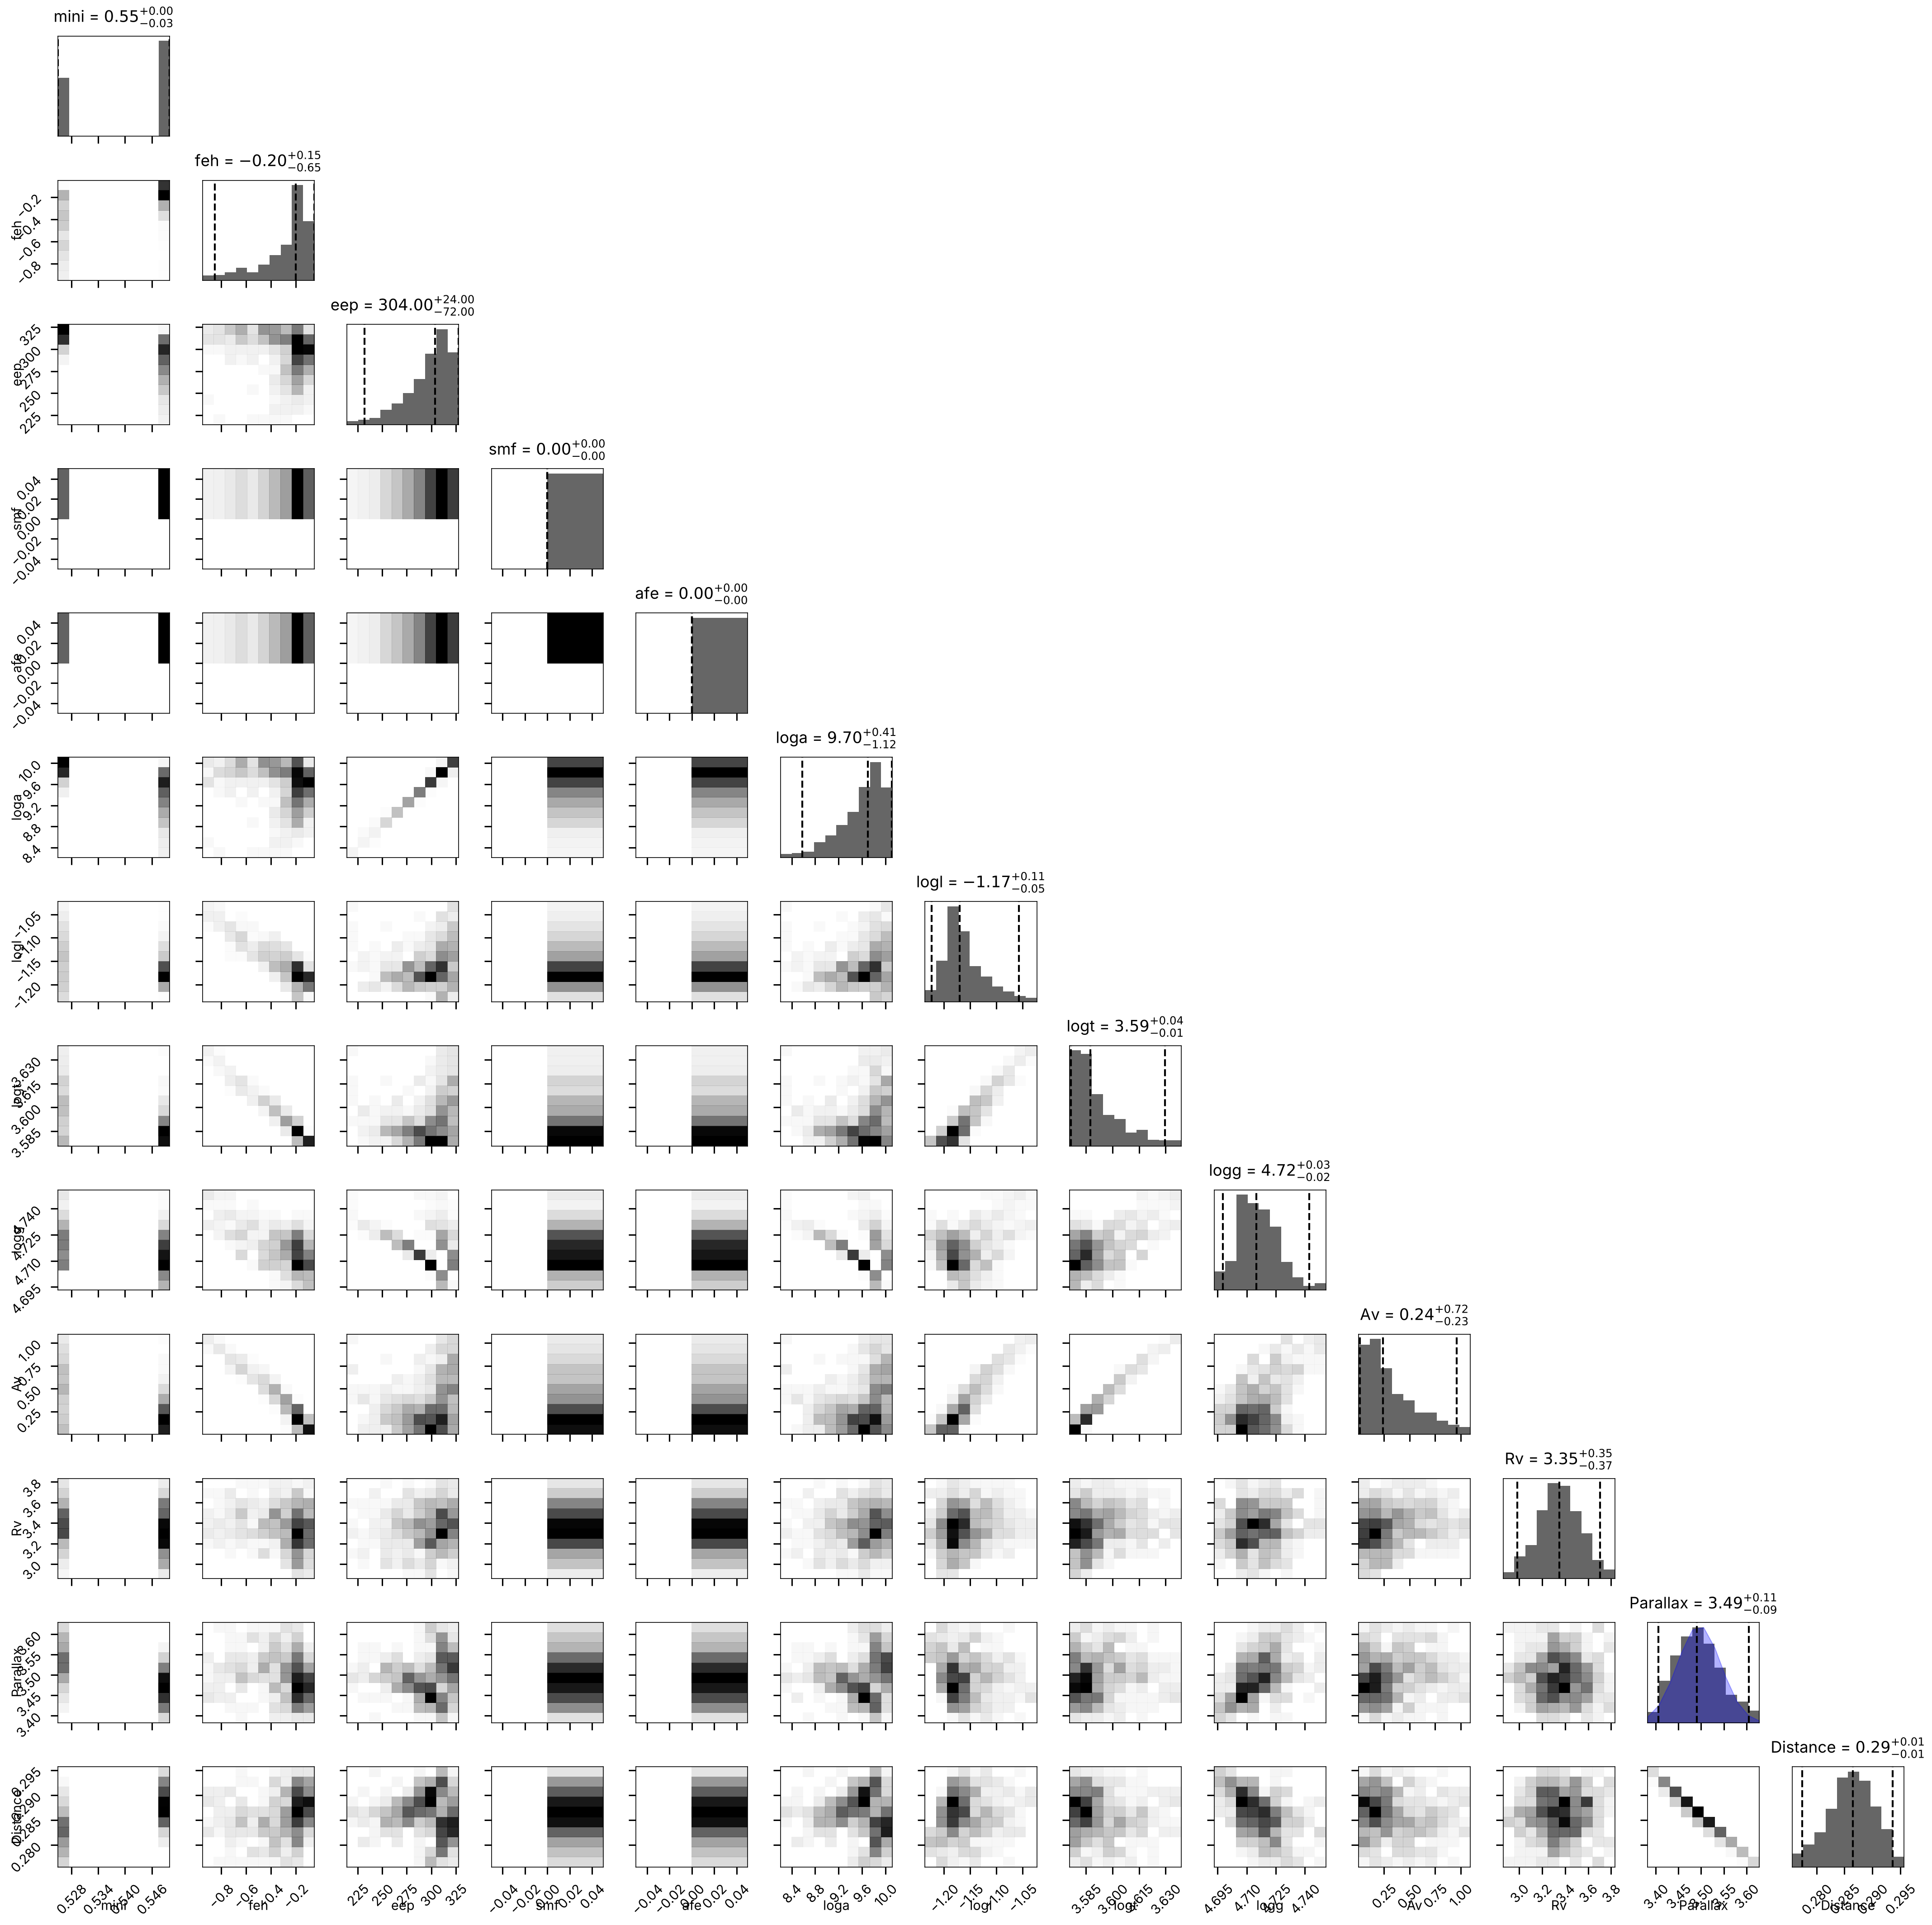
brutus provides built-in plotting functions for visualizing individual fitting results. We demonstrate three key plots for the selected example star.
from brutus.plotting import dist_vs_red, posterior_predictive, cornerplot

# Distance vs reddening posterior
fig, ax = plt.subplots(1, 1, figsize=(8, 6))
plt.sca(ax)

dist_vs_red(
    (dists[star_idx], reds[star_idx], dreds[star_idx]),
    parallax=data['parallax'][data_idx],
    parallax_err=data['parallax_err'][data_idx],
    coord=(data['coords'][data_idx, 0], data['coords'][data_idx, 1]),
)

plt.title('Distance vs Reddening Posterior')
save_figure(fig, 'dist_vs_red')
plt.show()
# Posterior predictive SED
fig, ax, parts = posterior_predictive(
    models,
    idxs=model_idx[star_idx],
    reds=reds[star_idx],
    dreds=dreds[star_idx],
    dists=dists[star_idx],
    data=data['phot'][data_idx],
    data_err=data['err'][data_idx],
    data_mask=data['mask'][data_idx],
    offset=offsets_mist,
    labels=filt,
)

plt.title('Posterior Predictive SED')
save_figure(fig, 'posterior_predictive')
plt.show()
# Corner plot of stellar parameters
fig, axes = cornerplot(
    idxs=model_idx[star_idx],
    data=(dists[star_idx], reds[star_idx], dreds[star_idx]),
    params=labels,
    coord=(data['coords'][data_idx, 0], data['coords'][data_idx, 1]),
    parallax=data['parallax'][data_idx],
    parallax_err=data['parallax_err'][data_idx],
    show_titles=True,
)

# Add padding to prevent axis label overlap with tick numbers
fig.subplots_adjust(bottom=0.15, left=0.15, hspace=0.1, wspace=0.1)

save_figure(fig, 'cornerplot')
plt.show()
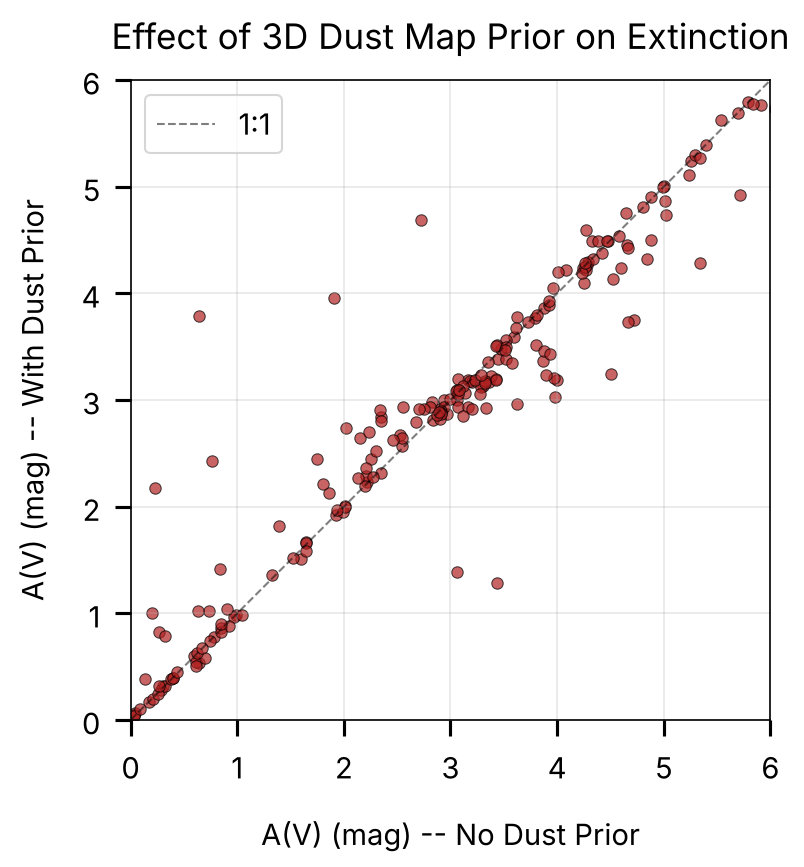
5. Impact of the 3D Dust Map Prior
The Bayestar 3D dust map provides distance-dependent extinction constraints
that can significantly affect the inferred stellar parameters. When a dust map
is available, BruteForce evaluates the extinction prior at each candidate
distance, preferring (distance, A_V) combinations consistent with the
cumulative dust profile along the line of sight.
To quantify this effect, we re-fit the same sources without the dust map prior and compare the resulting distance and extinction posteriors. Sources in highly extincted regions (like Orion) should show the largest differences.
# Re-fit the same sources WITHOUT the dust map prior
if dustfile is not None:
    output_file_nodust = TUTORIALS_DIR / 'Orion_l209.1_b-19.9_mist_nodust.h5'

    print(f"Running comparison fit WITHOUT dust map prior on {len(idx_fit)} sources...")
    print("This may take several minutes depending on your hardware.")

    t0 = time.time()

    bf.fit(
        data=data['phot'][idx_fit],
        data_err=data['err'][idx_fit],
        data_mask=data['mask'][idx_fit],
        data_labels=idx_fit,
        save_file=str(output_file_nodust),
        data_coords=data['coords'][idx_fit],
        parallax=data['parallax'][idx_fit],
        parallax_err=data['parallax_err'][idx_fit],
        phot_offsets=offsets_mist,
        dustfile=None,  # <-- No dust map
        Ndraws=500,
        Nmc_prior=20,
        logl_dim_prior=True,
        save_dar_draws=True,
        running_io=False,
        verbose=False
    )

    elapsed = time.time() - t0
    print(f"\nComparison fit complete in {elapsed:.1f} seconds ({elapsed/60:.1f} minutes).")
    record_file(output_file_nodust)
    print(f"Saved to {output_file_nodust.name}")

    # --- Load both result sets ---
    with h5py.File(output_file, 'r') as f:
        reds_dust = f['samps_red'][:]

    with h5py.File(output_file_nodust, 'r') as f:
        reds_nodust = f['samps_red'][:]

    mean_av_dust = np.mean(reds_dust, axis=1)
    mean_av_nodust = np.mean(reds_nodust, axis=1)

    # --- Single-panel A(V) comparison ---
    fig, ax = plt.subplots(figsize=(6, 6))
    ax.scatter(mean_av_nodust, mean_av_dust, s=30, alpha=0.7,
               c='firebrick', edgecolor='k', lw=0.5)
    ax.plot([0, 6], [0, 6], 'k--', lw=1, alpha=0.5, label='1:1')
    ax.set_xlabel('A(V) (mag) -- No Dust Prior')
    ax.set_ylabel('A(V) (mag) -- With Dust Prior')
    ax.set_title('Effect of 3D Dust Map Prior on Extinction')
    ax.set_xlim(0, 6)
    ax.set_ylim(0, 6)
    ax.legend()
    ax.grid(True, alpha=0.3)
    ax.set_aspect('equal')

    save_figure(fig, 'dust_prior_comparison')
    plt.show()

else:
    print("Dust map not available -- skipping comparison.")
    print("The dust prior comparison requires bayestar2019_v1.h5")
Running comparison fit WITHOUT dust map prior on 207 sources...
Comparison fit complete in 121.3 seconds (2.0 minutes).
Saved to Orion_l209.1_b-19.9_mist_nodust.h5
6. Advanced BruteForce Options
BruteForce.fit() accepts several configuration parameters that control the likelihood, priors, and posterior subsampling:
Parameter |
Default |
Description |
|---|---|---|
|
|
Applies a chi-square dimensionality prior on the likelihood instead of a flat Gaussian normalization. |
|
|
Multiplies by the MIST evolutionary-timescale weight ( |
|
|
Applies the grid-spacing Jacobian across |
|
|
Gaussian prior |
|
|
Gaussian prior |
|
|
Keeps models with weight above |
|
|
Fallback cumulative probability cutoff when |
|
|
Number of posterior draws saved per source. |
|
|
Monte Carlo draws per model for distance and extinction prior integration. |
|
|
Writes each object to the HDF5 file immediately after fitting. |
bf.fit(
    data=flux, data_err=flux_err, data_mask=mask,
    data_labels=obj_ids, save_file="results.h5",
    logl_dim_prior=True,
    apply_agewt=True,
    apply_grad=True,
    av_gauss=(0.3, 0.1),
    rv_gauss=(3.32, 0.18),
    wt_thresh=1e-3,
    Ndraws=250,
    Nmc_prior=50,
    running_io=True,
)
7. Summary and Key Takeaways
This tutorial has demonstrated how to fit individual stars using BruteForce:
Key Steps
Data Preparation
Convert magnitudes to flux (maggies)
Ensure proper error arrays and masks
Include parallax and coordinates when available
Model Setup
Load pre-computed model grids (MIST)
Apply photometric offsets for calibration
Initialize BruteForce with models
Running Fits
Configure priors (Galactic, dust, parallax)
Set sampling parameters (Ndraws, Nmc_prior)
Save results to HDF5 for analysis
Result Analysis
Assess fit quality with goodness-of-fit p-values (dof = Nbands - 3)
Analyze parameter distributions and correlations
Visualize individual SEDs and posteriors
Best Practices
Data Quality: Require SNR > 5 and >= 4 bands per source
Photometric Offsets: Always apply appropriate calibrations
Priors: Use 3D dust maps and parallax when available
Validation: Use goodness-of-fit p-values (p > 1e-3 indicates a good fit); chi2/Nbands is not a reliable quality metric across different band counts
Uncertainties: Use posterior samples for proper error estimation
Next Steps
Tutorial 6: Cluster Analysis and Population Fitting
Tutorial 7: 3D Dust Mapping
Tutorial 8: Photometric Calibration