Tutorial 10: Plotting Functions
brutus.plotting provides diagnostic and publication figures for posterior
distributions, spectral energy distributions (SEDs), photometric offset
residuals, and binned distance-reddening probability densities.
Functions Covered
Function |
Module |
Description |
|---|---|---|
|
|
Distance vs reddening posterior plot |
|
|
Bin distance-reddening posterior PDFs |
|
|
Corner plot of multi-dimensional posteriors |
|
|
Posterior predictive SED violin plot |
|
|
1-D photometric offset residuals |
The low-level 2-D density histogram utility hist2d (brutus.plotting.utils)
is called internally by cornerplot and can also be invoked directly for
custom 2-D density panels.
Prerequisites
The setup cell below checks the required data files; see Tutorial 00 for download instructions.
# Setup: imports and plot style
import warnings
from pathlib import Path

import numpy as np
import matplotlib.pyplot as plt

warnings.filterwarnings("ignore")

# Tutorial utilities
from tutorial_utils import (
    setup_tutorial,
    save_figure,
    print_section,
    find_brutus_data_file,
    load_example_results,
)

# Run the standardized tutorial bootstrap
info = setup_tutorial(10, title="Tutorial 10: Plotting Functions")

# Matplotlib defaults for this notebook
plt.rcParams["figure.figsize"] = (10, 6)
# ---------------------------------------------------------------
# Load pre-computed BruteForce results, input photometry, and models
# ---------------------------------------------------------------
import h5py
from brutus.utils import inv_magnitude
from brutus.data import load_models

DATA_AVAILABLE = False
PHOT_AVAILABLE = False
MODELS_AVAILABLE = False

# Filter names used in the Orion fitting run (PS1 grizy + 2MASS JHKs)
FILTER_NAMES = ['PS_g', 'PS_r', 'PS_i', 'PS_z', 'PS_y',
                '2MASS_J', '2MASS_H', '2MASS_Ks']
N_OBJ_RESULTS = None

# 1. Load BruteForce results
try:
    results = load_example_results("Orion_l209.1_b-19.9_mist.h5")
    DATA_AVAILABLE = True
    N_OBJ_RESULTS = results["model_idx"].shape[0]
    n_samps = results["model_idx"].shape[1]
    print("Loaded BruteForce results.")
    print(f"  File      : {Path(results['filename']).name}")
    print(f"  Objects   : {N_OBJ_RESULTS}")
    print(f"  Samples   : {n_samps}")
    print(f"  Keys      : {[k for k in sorted(results) if k != 'filename']}")
except FileNotFoundError as exc:
    print(f"Results file not found -- sections that need it will be skipped.")
    print(f"  ({exc})")

# 2. Load input photometry (subset to match results)
try:
    phot_path = find_brutus_data_file("Orion_l209.1_b-19.9.h5")
    with h5py.File(phot_path, "r") as f:
        fpix = f["photometry"]["pixel 0-0"]
        mag_all = fpix["mag"][:]
        magerr_all = fpix["err"][:]
        plx_all = fpix["parallax"][:]  # already in mas
        plx_err_all = fpix["parallax_error"][:]
        coords_all = np.c_[fpix["l"][:], fpix["b"][:]]

    # Convert to flux
    flux_all, flux_err_all = inv_magnitude(mag_all, magerr_all)
    mask_all = np.isfinite(magerr_all)

    # Subset to match results objects (first N)
    n_sub = N_OBJ_RESULTS if N_OBJ_RESULTS is not None else flux_all.shape[0]
    phot_flux = flux_all[:n_sub]
    phot_flux_err = flux_err_all[:n_sub]
    phot_mask = mask_all[:n_sub]
    phot_parallax = plx_all[:n_sub]
    phot_parallax_err = plx_err_all[:n_sub]
    phot_coords = coords_all[:n_sub]

    PHOT_AVAILABLE = True
    print(f"\nLoaded input photometry from {Path(phot_path).name}")
    print(f"  Total objects  : {flux_all.shape[0]}")
    print(f"  Subset matched : {n_sub}")
    print(f"  Filters        : {flux_all.shape[1]}")
except FileNotFoundError as exc:
    print(f"\nInput photometry not found (optional).")
    print(f"  ({exc})")

# 3. Load model grid (needed for SED, cornerplot, and offset plots)
try:
    grid_path = find_brutus_data_file("grid_mist_v9.h5")
    models, grid_labels, label_mask = load_models(grid_path, filters=FILTER_NAMES, verbose=False)
    MODELS_AVAILABLE = True
    print(f"\nLoaded model grid from {Path(grid_path).name}")
    print(f"  models shape  : {models.shape}  (Nmodels, Nfilt, Ncoeff)")
    print(f"  labels shape  : {grid_labels.shape}")
    print(f"  labels fields : {list(grid_labels.dtype.names)}")
except FileNotFoundError as exc:
    print(f"\nModel grid not found.")
    print(f"  ({exc})")
Loaded BruteForce results from Orion_l209.1_b-19.9_mist.h5 (207 objects, 500 samples)
Loaded input photometry from Orion_l209.1_b-19.9.h5 (207 objects, 8 filters)
Loaded model grid from grid_mist_v9.h5: models=(613530, 8, 3), labels=(613530,)
Section 2: Distance-Extinction Visualization
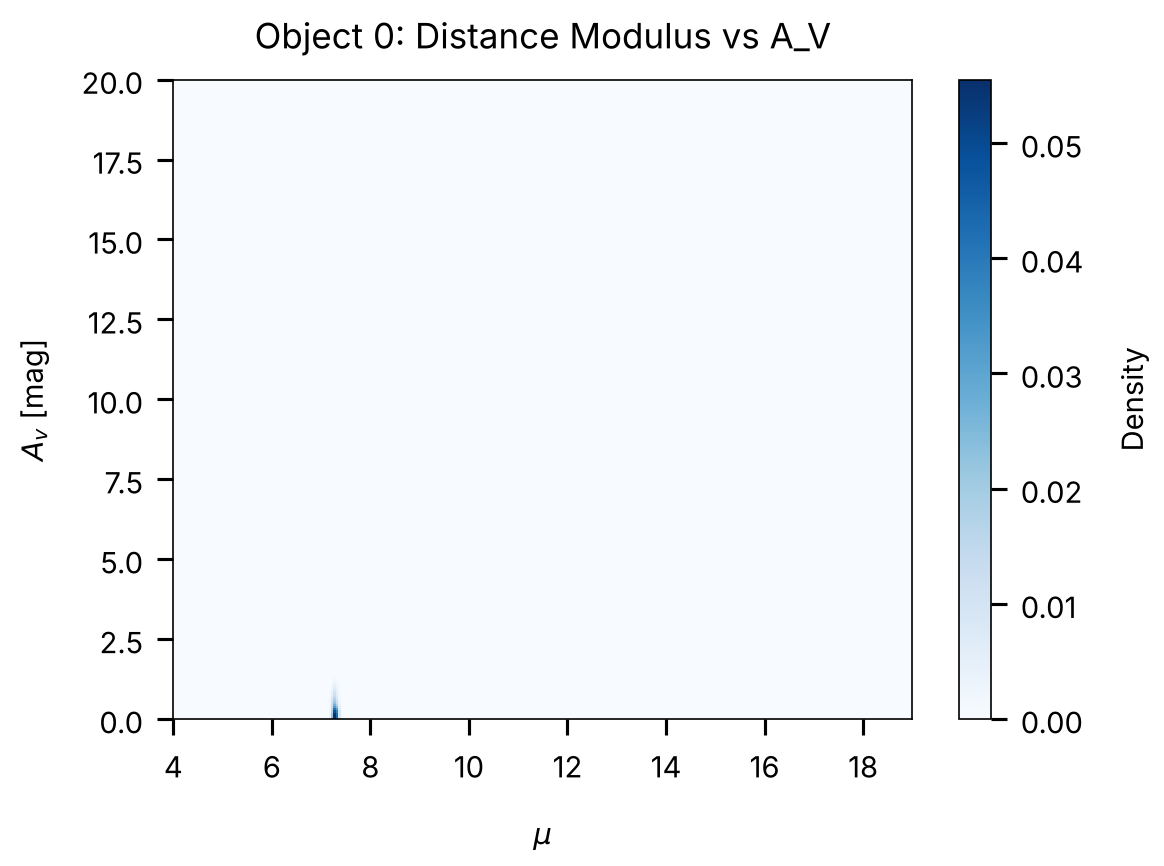
dist_vs_red and bin_pdfs_distred visualize joint distance-extinction posteriors:
dist_vs_redrenders a 2-D density image of the joint distance-reddening posterior. It accepts a single object ((Nsamps,)arrays) or multiple objects ((Nobj, Nsamps)arrays, plotting the average of the per-object 2-D PDFs), along with optional importanceweights((Nsamps,)shared across objects or(Nobj, Nsamps)).bin_pdfs_distredbins rawBruteForceoutputs for multiple objects into 2-D PDFs over the distance-reddening plane.
dist_vs_red Signature
dist_vs_red(data, ebv=None, dist_type='distance_modulus', lndistprior=None,
            coord=None, avlim=(0., 20.), rvlim=(1., 8.), weights=None,
            parallax=None, parallax_err=None, Nr=300, cmap='Blues',
            bins=300, span=None, smooth=(0.015, 0.005), plot_kwargs=None,
            truths=None, truth_color='red', truth_kwargs=None, rstate=None,
            fig=None)
data is either a 4-tuple (scales, avs, rvs, covs_sar) of per-model
BruteForce outputs or a 3-tuple (dists, reds, dreds) of pre-drawn
samples. When regenerating distance samples from the 4-tuple format, pass
Galactic coordinates (coord) and parallax measurements; a single (l, b)
pair is broadcast across all objects.
bin_pdfs_distred Signature
bin_pdfs_distred(
    data,           # 4-tuple (scales, avs, rvs, covs_sar) or 3-tuple
    cdf=False, ebv=False, dist_type='distance_modulus',
    lndistprior=None, coord=None, avlim=(0., 20.), rvlim=(1., 8.),
    weights=None, parallaxes=None, parallax_errors=None, Nr=100,
    bins=(750, 300), span=None, smooth=(0.01, 0.005), rstate=None, verbose=False,
    R_solar=8.2, Z_solar=0.025,
)
Returns (binned_vals, xedges, yedges) where binned_vals has shape
(Nobj, Nxbin, Nybin). With cdf=True the PDFs are cumulated along the
reddening axis (useful when evaluating MAP line-of-sight dust fits).
Optional weights must have shape (Nobj, Nsamps), be finite and
non-negative, and sum to a positive value for each object; each object’s
binned PDF is normalized by its total weight, so results are invariant
to the absolute scale of the weights.
from brutus.plotting import dist_vs_red

if not DATA_AVAILABLE:
    print("SKIPPED -- results file not available.")
else:
    # Pick the first object as an example
    idx = 0

    # Build the 4-tuple that dist_vs_red expects (scale, Av, Rv, cov_sar)
    data_tuple = (
        results["ml_scale"][idx],
        results["ml_av"][idx],
        results["ml_rv"][idx],
        results["ml_cov_sar"][idx],
    )

    # Galactic coordinates for the distance prior
    coord = tuple(phot_coords[idx]) if PHOT_AVAILABLE else (209.1, -19.9)

    # Parallax
    plx = phot_parallax[idx] if PHOT_AVAILABLE else None
    plx_err = phot_parallax_err[idx] if PHOT_AVAILABLE else None

    fig = plt.figure(figsize=(8, 6))
    H, xedges, yedges, img = dist_vs_red(
        data_tuple,
        coord=coord,
        parallax=plx,
        parallax_err=plx_err,
        dist_type="distance_modulus",
        cmap="Blues",
        smooth=(0.015, 0.005),
        bins=300,
    )
    plt.title(f"Object {idx}: Distance Modulus vs A_V")
    plt.colorbar(img, label="Density")

    save_figure(fig, 10, "dist_vs_red_demo")
    plt.show()
Binning Distance-Reddening PDFs with bin_pdfs_distred
bin_pdfs_distred operates on multiple objects simultaneously and
returns the raw binned arrays, which can be further processed or
visualized directly.
from brutus.plotting import bin_pdfs_distred

if not DATA_AVAILABLE:
    print("SKIPPED -- results file not available.")
else:
    # Use a small subset of objects to keep runtime short
    n_demo = min(5, results["ml_scale"].shape[0])

    data_tuple = (
        results["ml_scale"][:n_demo],
        results["ml_av"][:n_demo],
        results["ml_rv"][:n_demo],
        results["ml_cov_sar"][:n_demo],
    )

    # Coordinates for the distance prior
    if PHOT_AVAILABLE:
        coords_demo = [tuple(c) for c in phot_coords[:n_demo]]
    else:
        coords_demo = [(209.1, -19.9)] * n_demo

    plx_demo = phot_parallax[:n_demo] if PHOT_AVAILABLE else None
    plx_err_demo = phot_parallax_err[:n_demo] if PHOT_AVAILABLE else None

    binned_vals, xedges, yedges = bin_pdfs_distred(
        data_tuple,
        coord=coords_demo,
        parallaxes=plx_demo,
        parallax_errors=plx_err_demo,
        bins=(200, 100),
        smooth=(0.015, 0.005),
        verbose=False,
    )
    print(f"\nbinned_vals shape : {binned_vals.shape}  (Nobj, Nxbin, Nybin)")
    print(f"xedges shape      : {xedges.shape}")
    print(f"yedges shape      : {yedges.shape}")

    # Visualise the binned PDFs for each object
    fig, axes = plt.subplots(1, n_demo, figsize=(4 * n_demo, 4), squeeze=False)
    for i in range(n_demo):
        ax = axes[0, i]
        ax.imshow(
            binned_vals[i].T,
            origin="lower",
            aspect="auto",
            extent=[xedges[0], xedges[-1], yedges[0], yedges[-1]],
            cmap="Blues",
        )
        ax.set_xlabel(r"$\mu$ (dist mod)")
        if i == 0:
            ax.set_ylabel(r"$A_V$ (mag)")
        ax.set_title(f"Object {i}")

    plt.suptitle("bin_pdfs_distred: Binned Distance-Reddening PDFs", fontsize=14)
    save_figure(fig, 10, "bin_pdfs_distred_demo")
    plt.show()
binned_vals shape: (5, 200, 100) (xedges: (201,), yedges: (101,))

Section 3: cornerplot (Corner Plot of Posteriors)
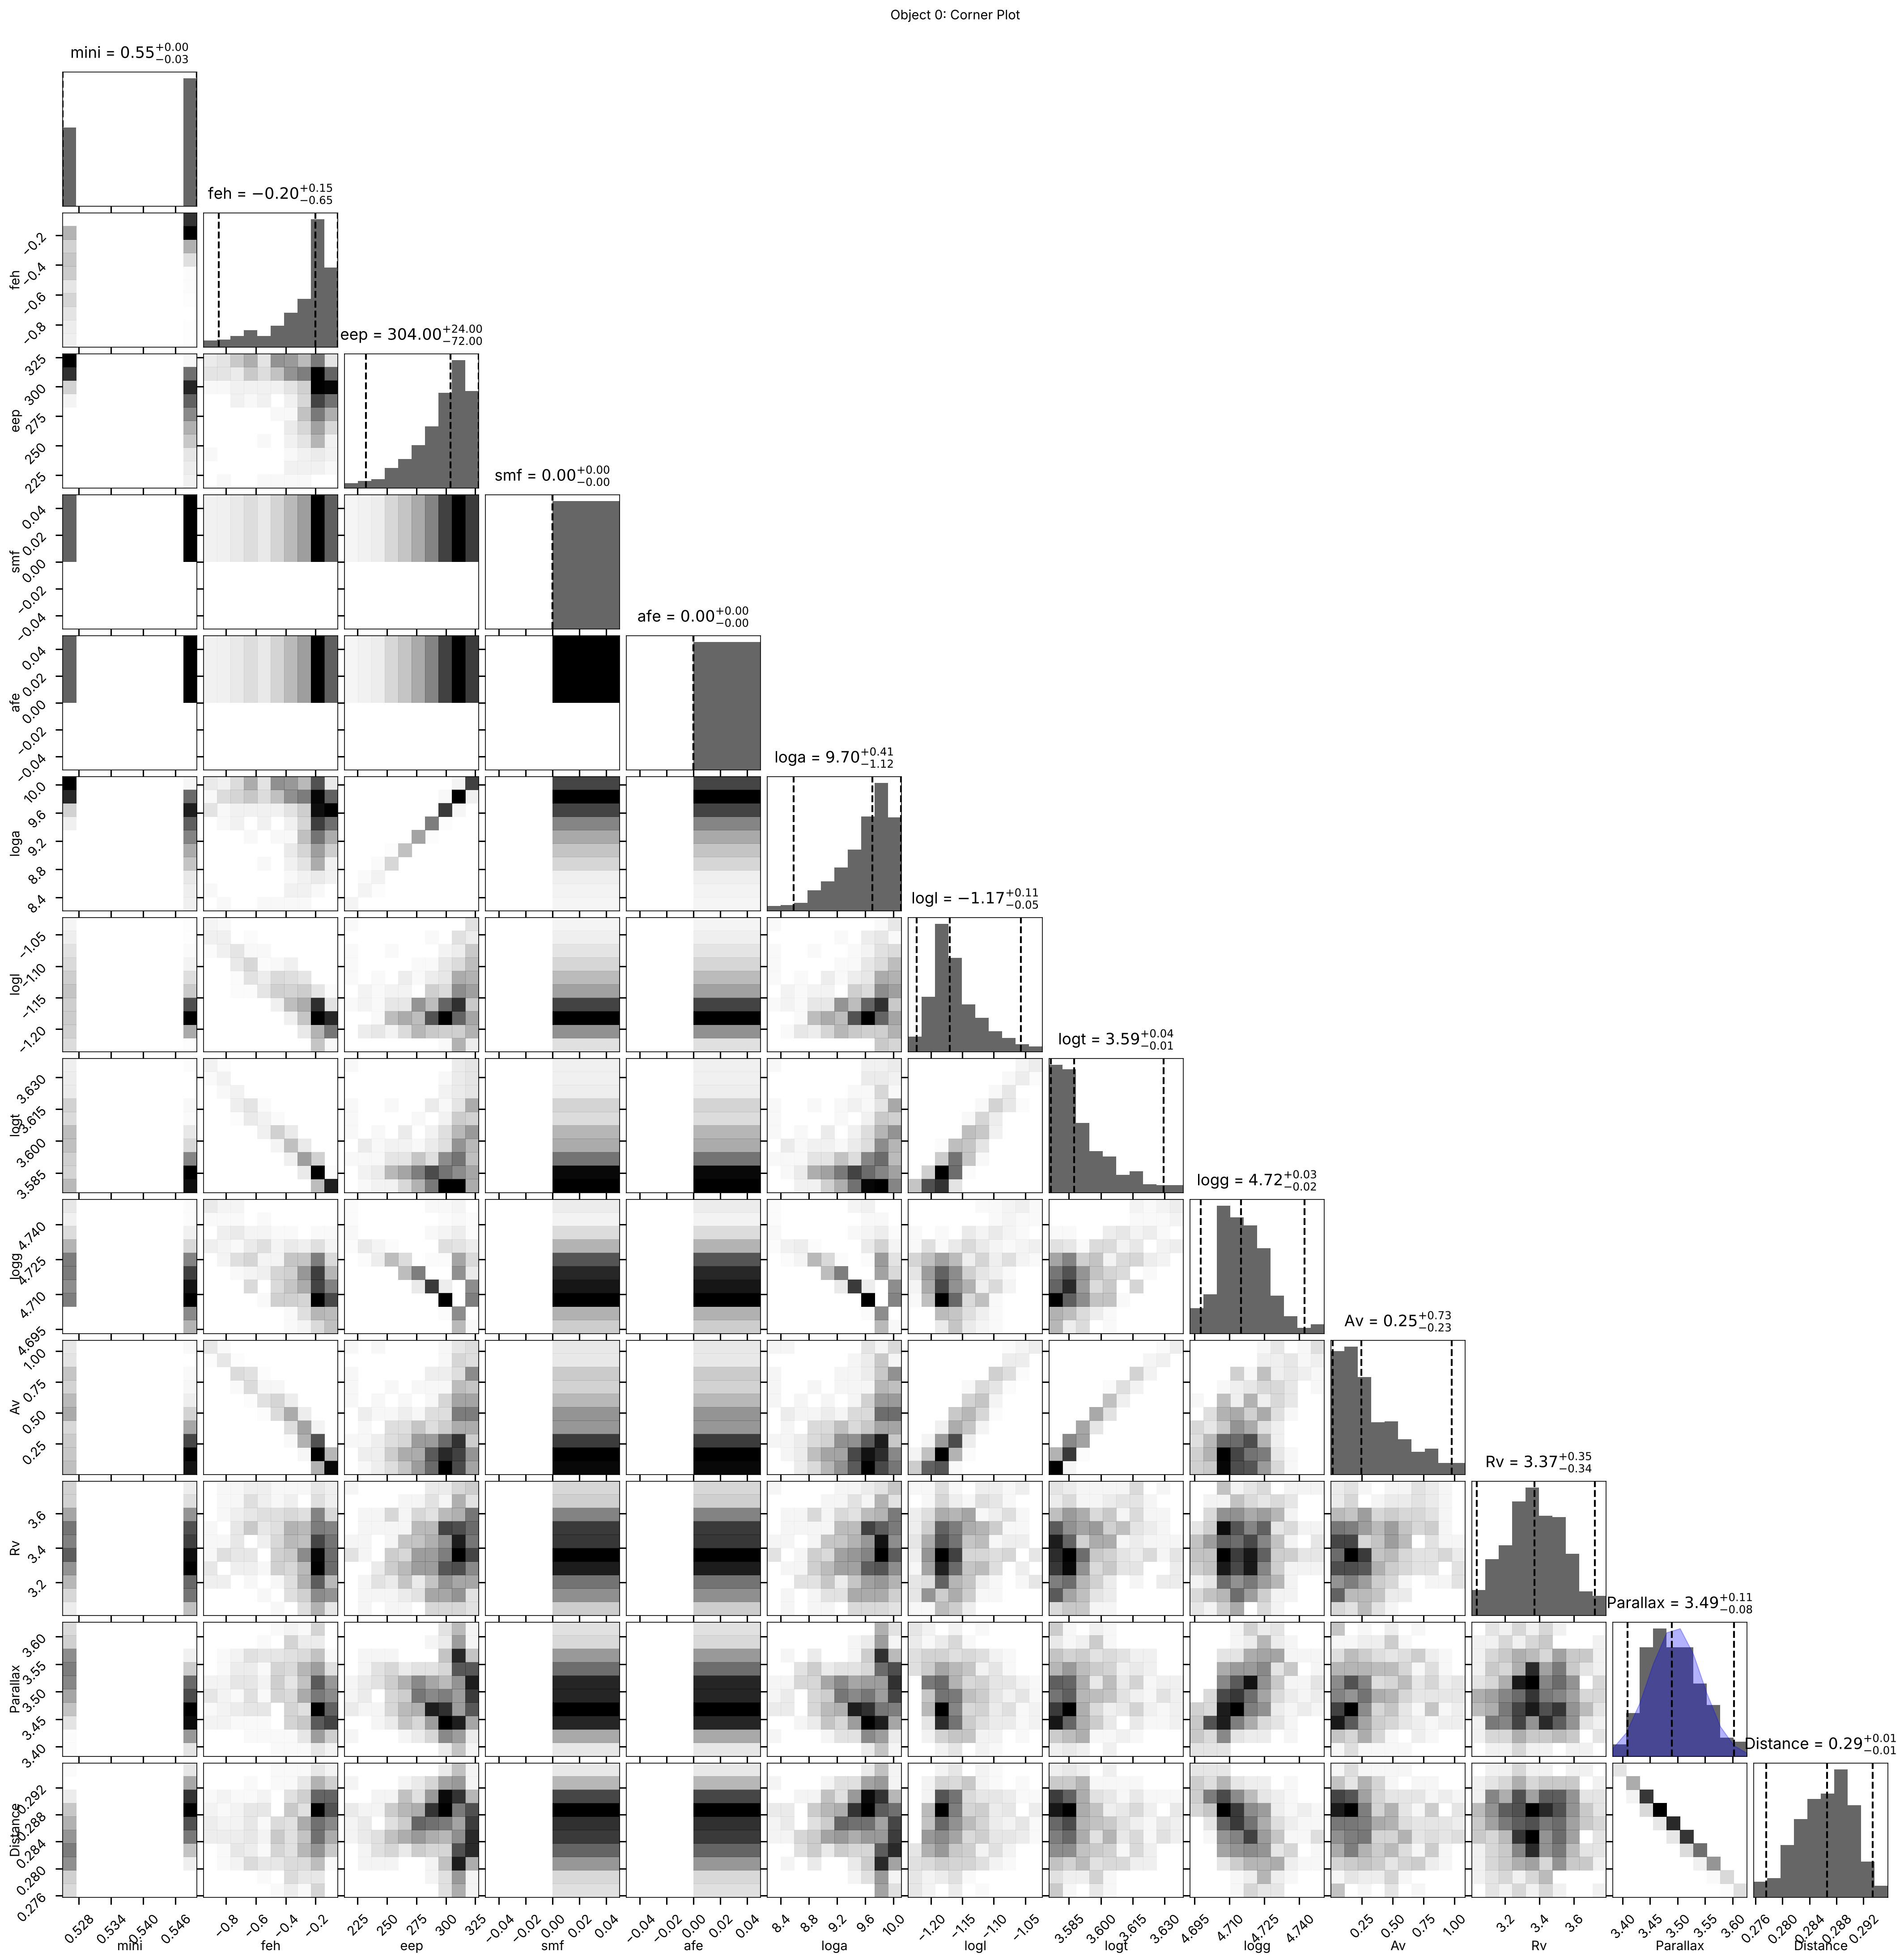
cornerplot generates a corner plot showing 1-D and 2-D marginalized
posteriors for all stellar parameters (from the model grid labels) plus
\(A_V\), \(R_V\), parallax, and distance.
Signature
cornerplot(idxs, data, params,
           lndistprior=None, coord=None, avlim=(0., 20.), rvlim=(1., 8.),
           weights=None, parallax=None, parallax_err=None, Nr=500,
           applied_parallax=None, pcolor='blue', parallax_kwargs=None,
           span=None, quantiles=[0.025, 0.5, 0.975], color='black',
           smooth=10, hist_kwargs=None, hist2d_kwargs=None, labels=None,
           label_kwargs=None, show_titles=False, title_fmt='.2f',
           title_kwargs=None, title_quantiles=[0.025, 0.5, 0.975],
           truths=None, truth_color='red', truth_kwargs=None,
           max_n_ticks=5, top_ticks=False, use_math_text=False,
           verbose=False, fig=None, rstate=None,
           R_solar=8.2, Z_solar=0.025)
Required inputs:
idxs: resampled model indices of shape(Nsamps,).data: 4-tuple(scales, avs, rvs, covs_sar)or 3-tuple(dists, reds, dreds).params: structured array of model parameters fromload_models.
from brutus.plotting import cornerplot

if DATA_AVAILABLE and MODELS_AVAILABLE:
    idx = 0

    idxs_obj = results["model_idx"][idx]
    data_tuple = (
        results["ml_scale"][idx],
        results["ml_av"][idx],
        results["ml_rv"][idx],
        results["ml_cov_sar"][idx],
    )

    coord = tuple(phot_coords[idx]) if PHOT_AVAILABLE else (209.1, -19.9)
    plx = phot_parallax[idx] if PHOT_AVAILABLE else None
    plx_err = phot_parallax_err[idx] if PHOT_AVAILABLE else None

    fig, axes = cornerplot(
        idxs_obj,
        data_tuple,
        grid_labels,
        coord=coord,
        parallax=plx,
        parallax_err=plx_err,
        smooth=10,
        show_titles=True,
        verbose=False,
    )
    fig.suptitle(f"Object {idx}: Corner Plot", y=1.02, fontsize=14)

    save_figure(fig, 10, "cornerplot_demo", tight=False)
    plt.show()
Section 4: posterior_predictive (SED Posterior Predictive Plot)
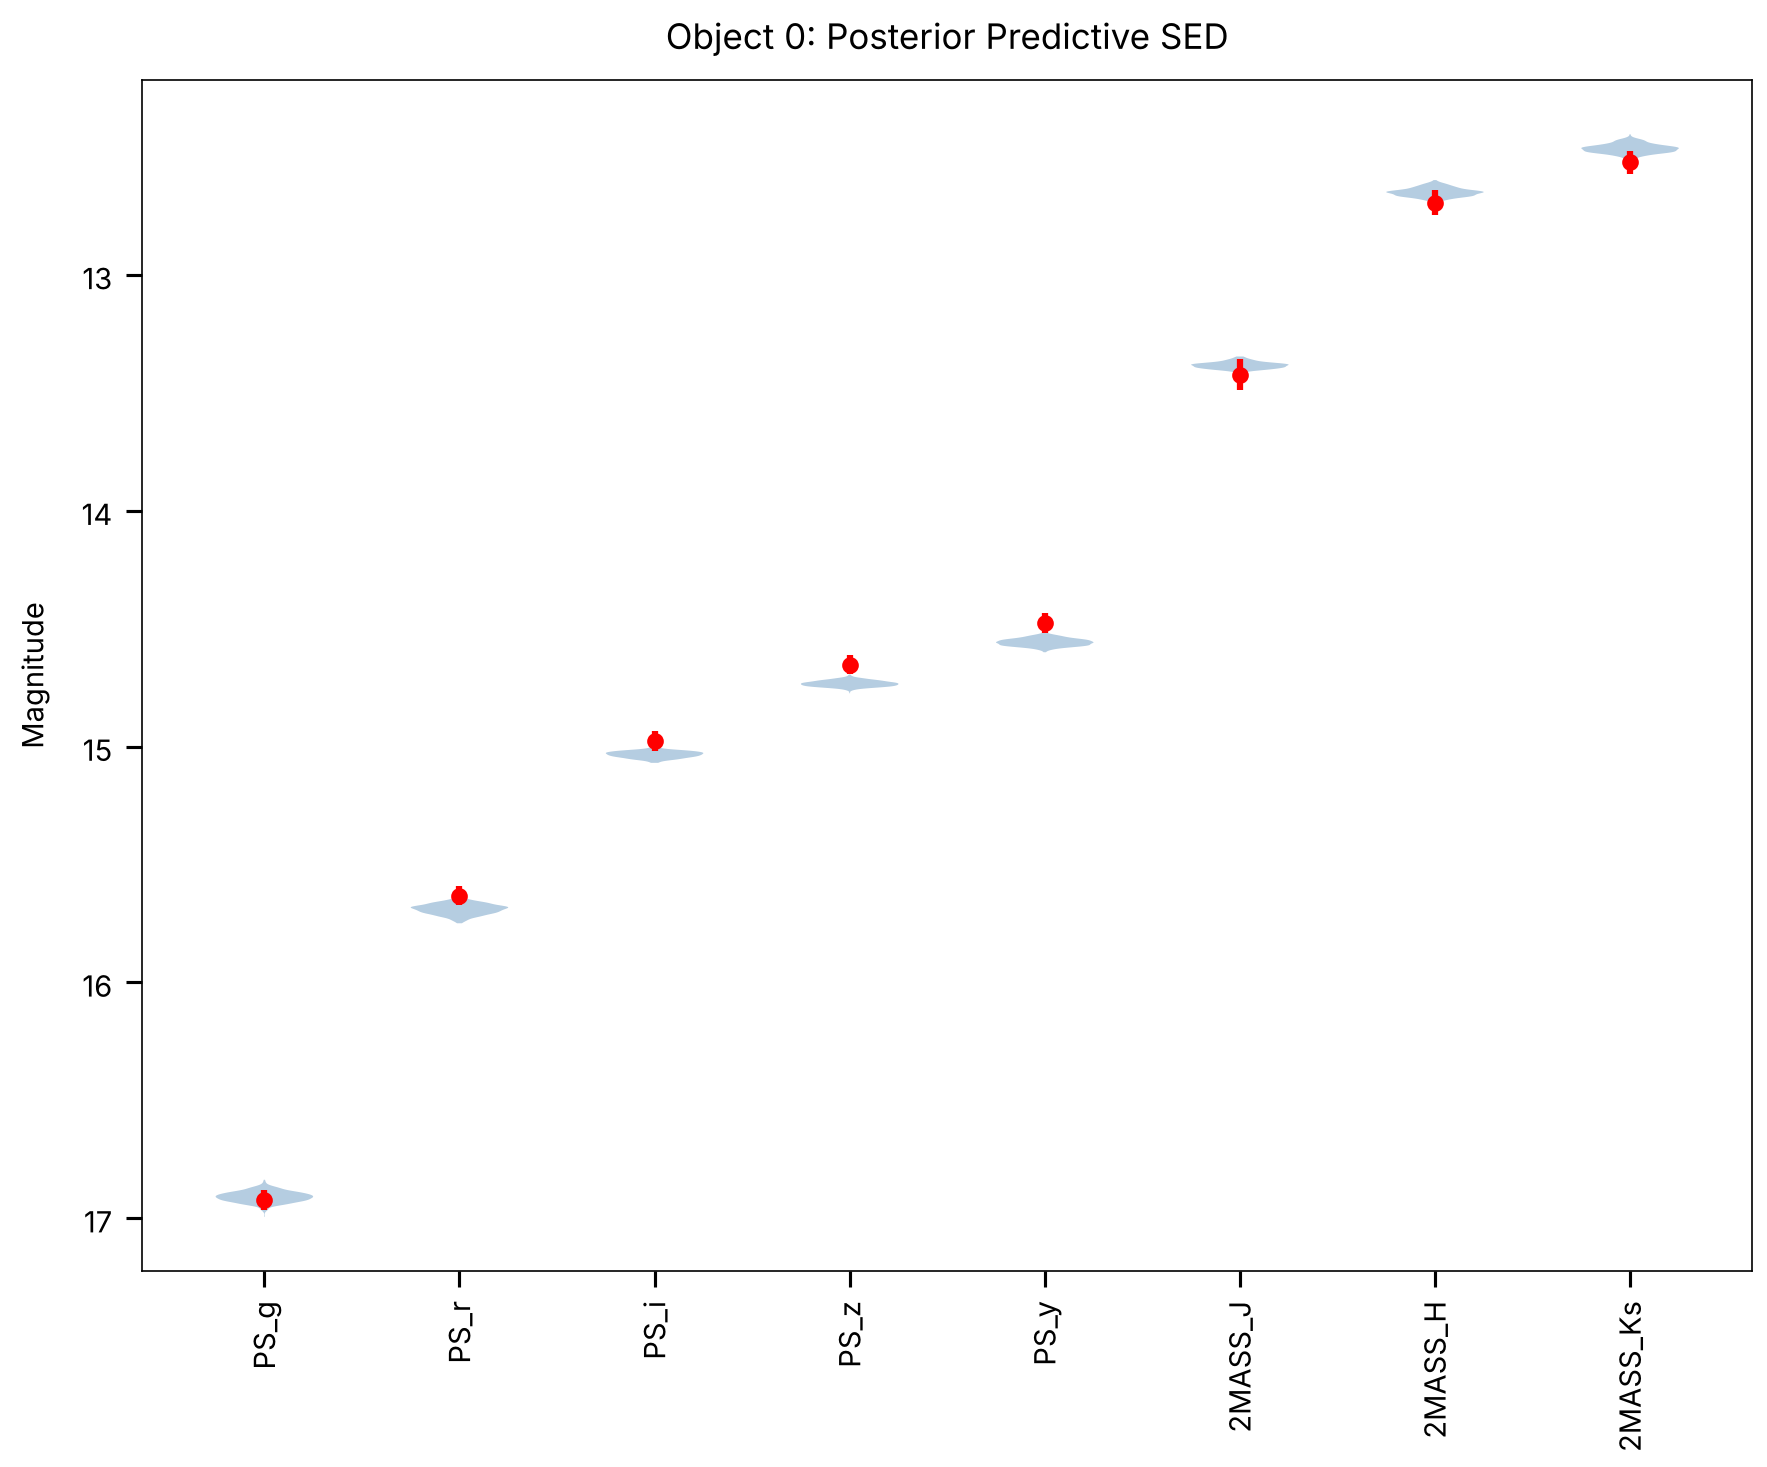
posterior_predictive shows the predicted SED (as violin plots across
filters) compared with observed photometry. It uses the model
polynomial coefficients array (models) and pre-computed posterior
samples (model_idx, samps_red, samps_dred, samps_dist) from
BruteForce output.
Signature
posterior_predictive(models, idxs, reds, dreds, dists,
                     weights=None, flux=False,
                     data=None, data_err=None, data_mask=None,
                     offset=None, vcolor='black', pcolor='black',
                     labels=None, rstate=None, psig=2., fig=None)
from brutus.plotting import posterior_predictive

if DATA_AVAILABLE and MODELS_AVAILABLE:
    idx = 0

    # Use pre-computed posterior samples directly from BruteForce output
    idxs_obj = results["model_idx"][idx]
    reds_obj = results["samps_red"][idx]      # A_V samples
    dreds_obj = results["samps_dred"][idx]    # R_V samples
    dists_obj = results["samps_dist"][idx]    # distance in kpc

    # Observed photometry for overplot
    obs_flux = phot_flux[idx] if PHOT_AVAILABLE else None
    obs_err = phot_flux_err[idx] if PHOT_AVAILABLE else None
    obs_mask = phot_mask[idx] if PHOT_AVAILABLE else None

    fig, ax, parts = posterior_predictive(
        models,
        idxs_obj,
        reds_obj,
        dreds_obj,
        dists_obj,
        data=obs_flux,
        data_err=obs_err,
        data_mask=obs_mask,
        labels=FILTER_NAMES,
        vcolor="steelblue",
        pcolor="red",
    )
    ax.set_title(f"Object {idx}: Posterior Predictive SED")

    save_figure(fig, 10, "posterior_predictive_demo")
    plt.show()
Section 5: photometric_offsets (1-D Offset Residuals)
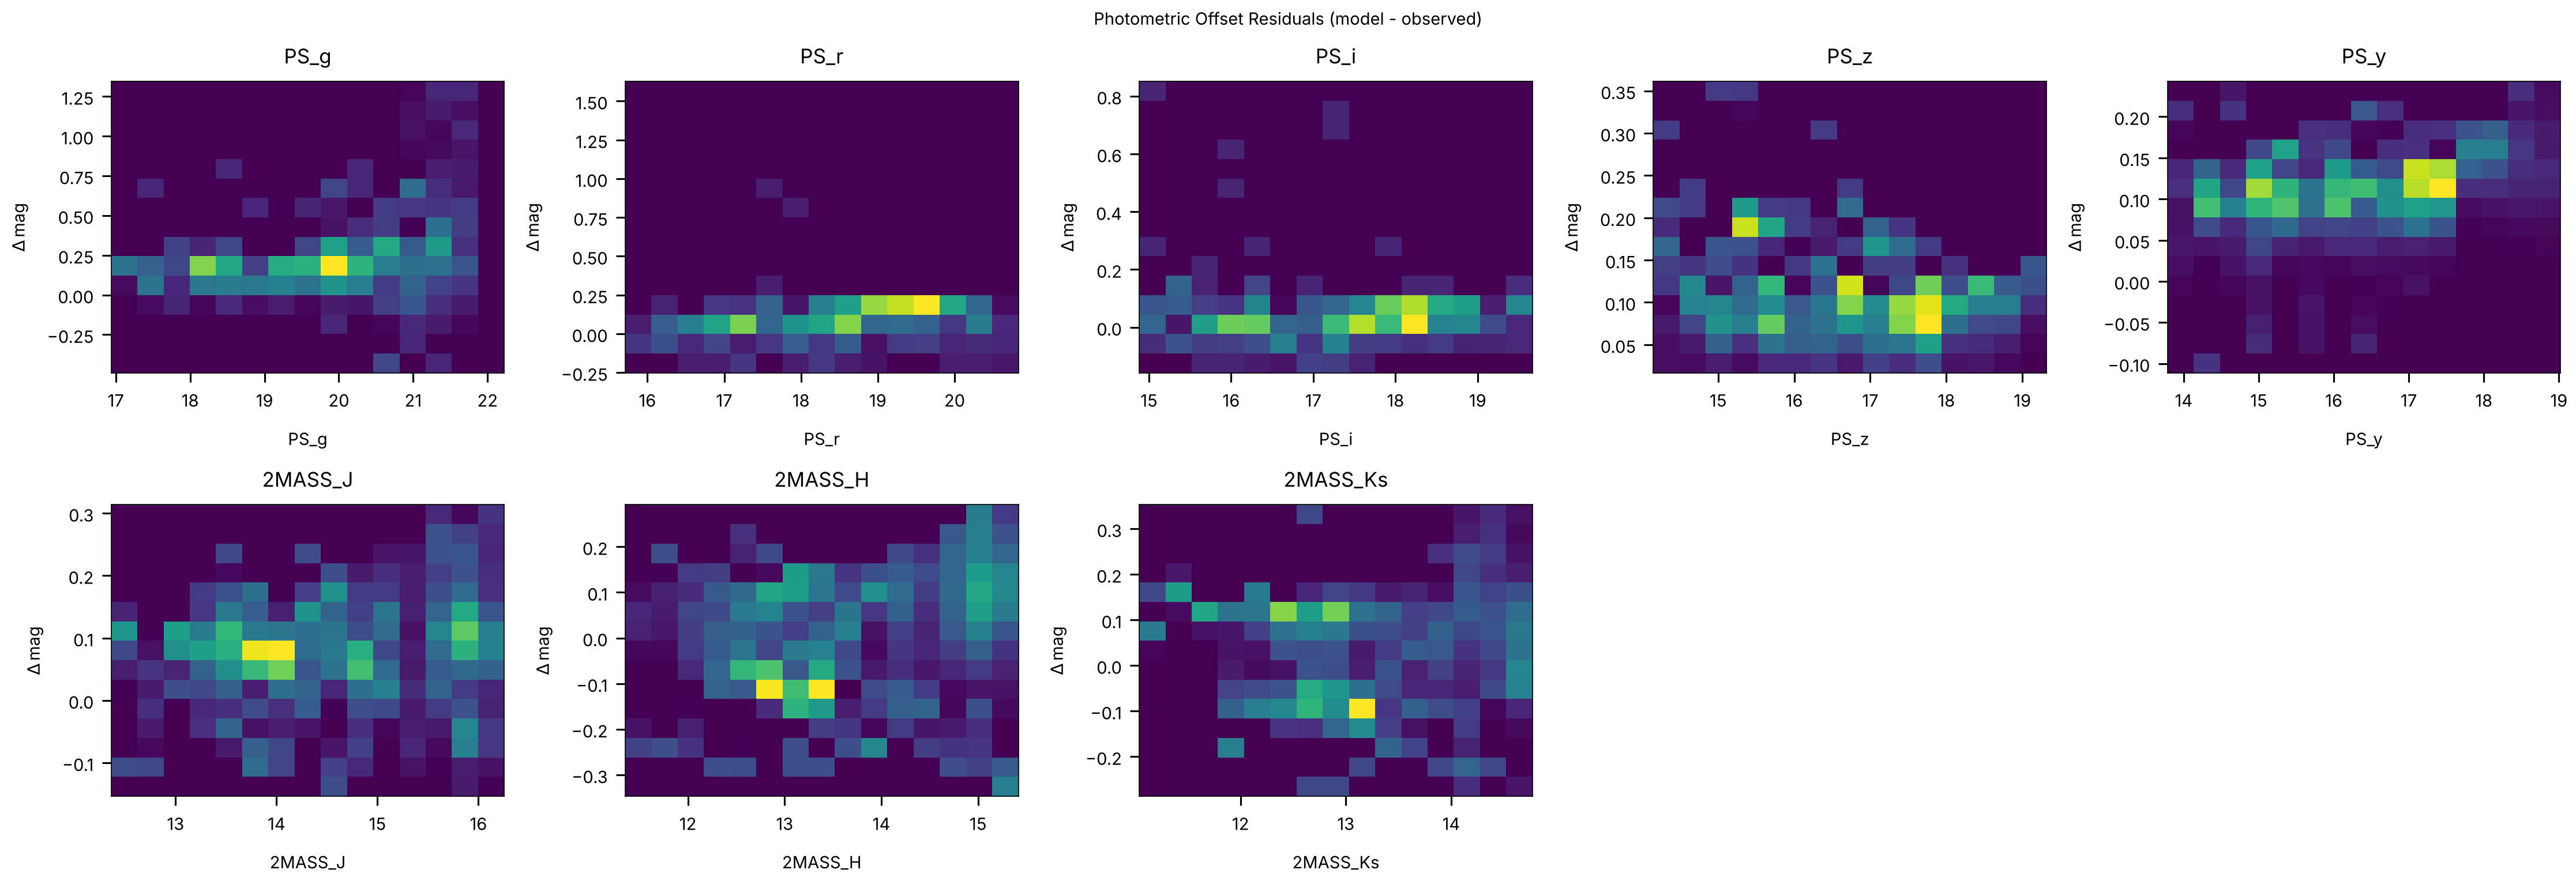
photometric_offsets computes mag_pred - mag_obs for every band and
plots the residual as a function of observed magnitude. Each panel
corresponds to one photometric filter to diagnose systematic model-data
discrepancies as a function of brightness.
This plotting function (brutus.plotting.offsets) is distinct from the
calibration function brutus.analysis.offsets.photometric_offsets in
Tutorial 8, which estimates multiplicative flux corrections.
Signature
photometric_offsets(
    phot, err, mask, models, idxs, reds, dreds, dists,
    x=None, flux=True, weights=None, bins=100,
    offset=None, plot_thresh=0.,
    cmap='viridis', xspan=None, yspan=None,
    titles=None, xlabel=None, plot_kwargs=None, fig=None,
)
from brutus.plotting import photometric_offsets as plot_phot_offsets

if DATA_AVAILABLE and MODELS_AVAILABLE and PHOT_AVAILABLE:
    # Use all fitted objects with their posterior samples
    fig, axes = plot_phot_offsets(
        phot_flux,
        phot_flux_err,
        phot_mask,
        models,
        results["model_idx"],
        results["samps_red"],
        results["samps_dred"],
        results["samps_dist"],
        flux=True,
        bins=15,
        titles=FILTER_NAMES,
        cmap="viridis",
    )
    fig.suptitle(
        "Photometric Offset Residuals (model - observed)",
        fontsize=14, y=1.02,
    )

    save_figure(fig, 10, "photometric_offsets_demo", tight=False)
    plt.show()
Summary
# |
Function |
Section |
Data Used |
|---|---|---|---|
1 |
|
Section 2 |
BruteForce posteriors |
2 |
|
Section 2 |
BruteForce posteriors |
3 |
|
Section 3 |
BruteForce posteriors + grid labels |
4 |
|
Section 4 |
BruteForce posteriors + grid models |
5 |
|
Section 5 |
BruteForce posteriors + models + photometry |
Key Points
bin_pdfs_distredbins per-object distance-reddening PDFs onto a 2-D grid, anddist_vs_redrenders the resulting density.cornerplotdisplays 1-D and 2-D marginals across stellar labels, \(A_V\), \(R_V\), parallax, and distance usinghist2d.posterior_predictivecompares predicted and observed SEDs across filters.brutus.plotting.photometric_offsetsvisualizes magnitude residuals across brightness, complementing the multiplicative offset solver inbrutus.analysis.offsets(Tutorial 8).